To get a clearer picture, we need to zoom in. Here is the monthly chart for $ADA .
On the monthly chart, the price is holding above a key support zone.
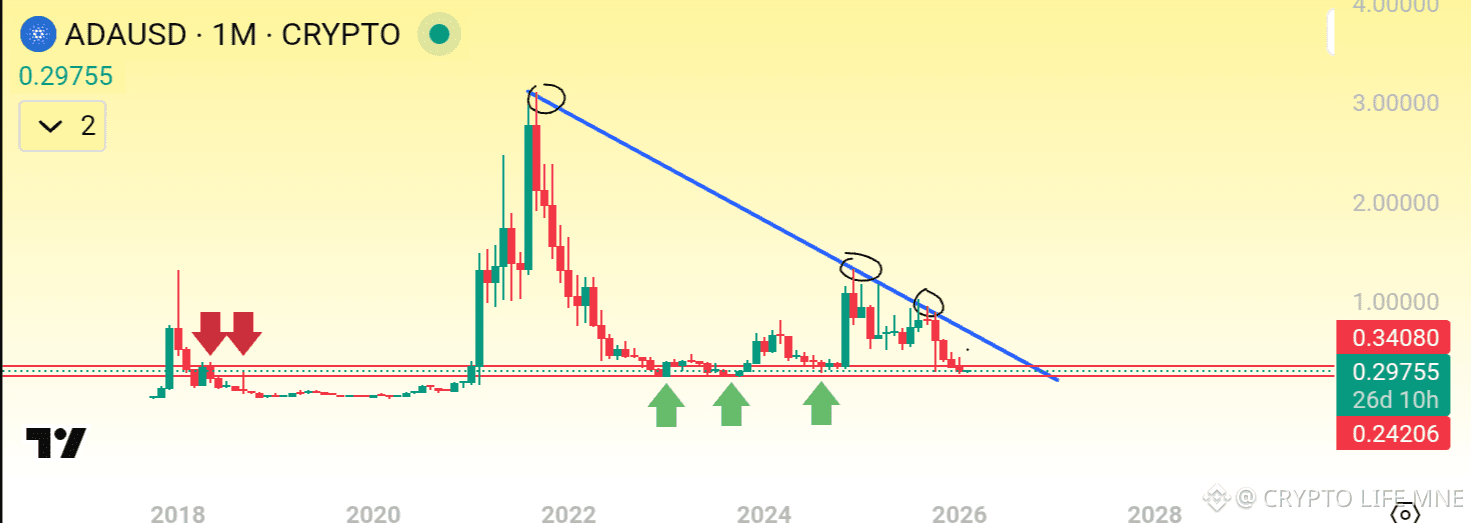
The $0.3500 – $0.2350 zone is a critical support level for $ADA for several reasons:
Historical Resistance: This zone acted as major resistance twice back in 2018.
Established Support: It successfully flipped into support and held twice in 2023.
Recent Validation: The same level acted as support again in 2024 and most recently in October 2025.
Current Outlook: As $ADA approaches this zone once more, there is a high probability of another bounce from these levels.
ADA Weekly Chart Analysis
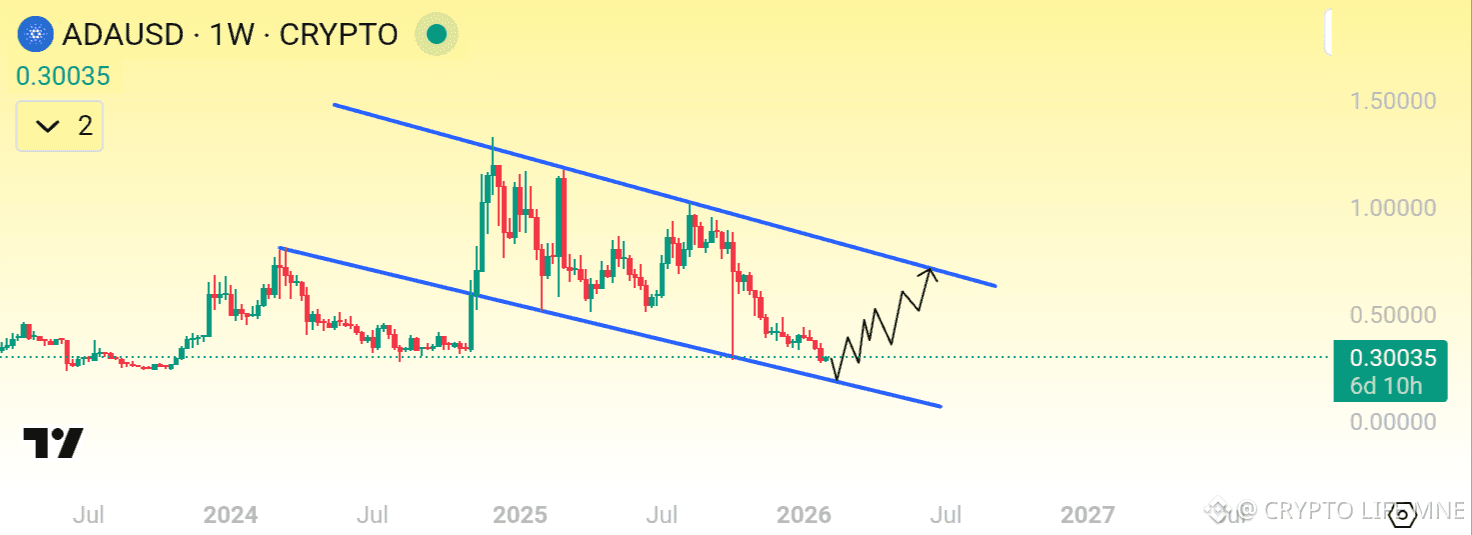
On the weekly chart, ADA is trading within a Descending Channel. It is currently testing the base of the pattern, which is a bullish signal. Furthermore, the price has successfully grabbed liquidity below the October "flash crash" wick.
This sweep of liquidity suggests a potential mid-term recovery toward the channel's upper resistance line.
Now, let's look at the Daily Chart.
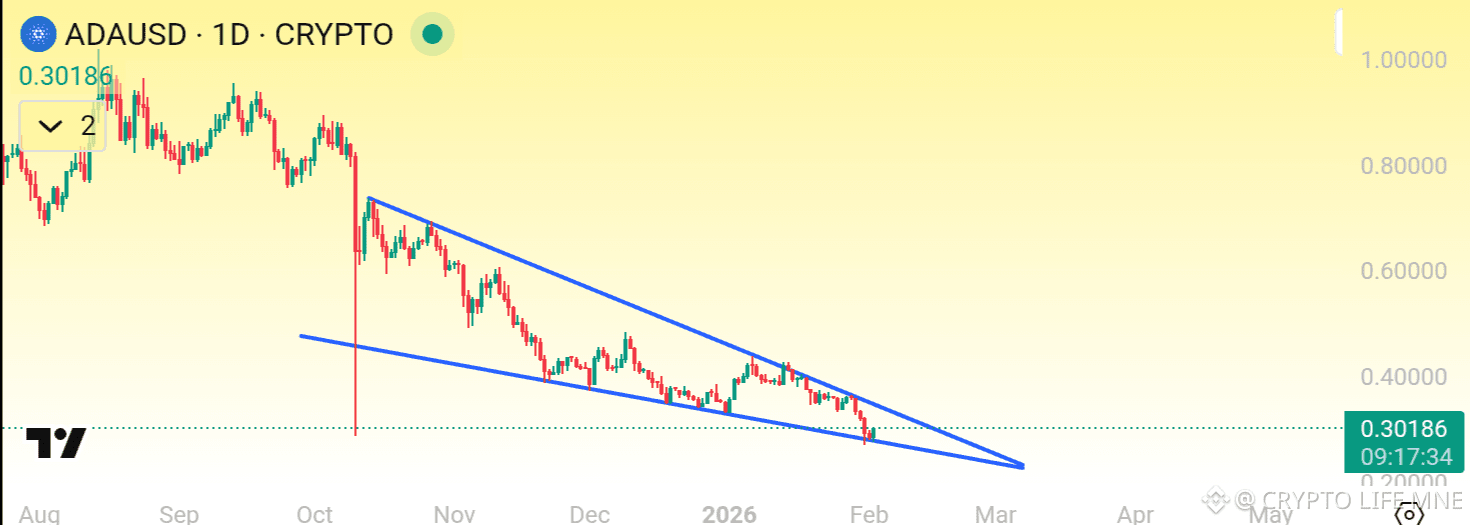
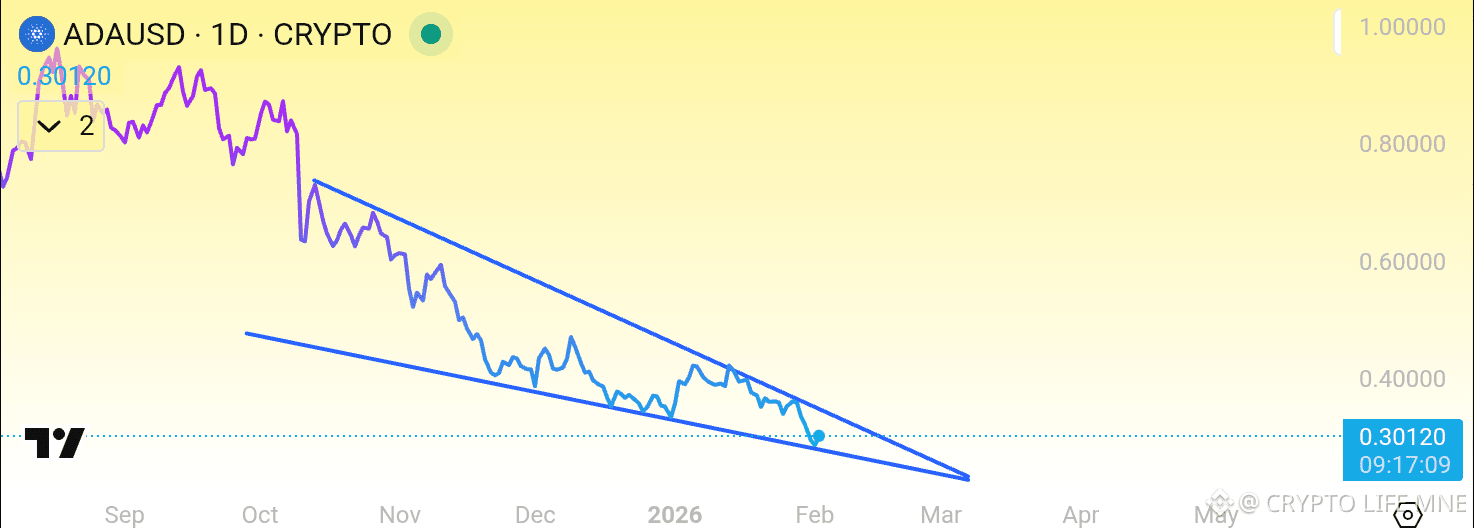
The daily chart reflects the same bullish sentiment. ADA is currently trading within a Falling Wedge, which is a high-probability bullish reversal pattern.
After testing the base (lower support) of the wedge, the price has started to bounce—a very positive signal. A confirmed breakout from this pattern would likely lead to a strong upside recovery.
Now, let’s take a look at the 4-hour chart as well.
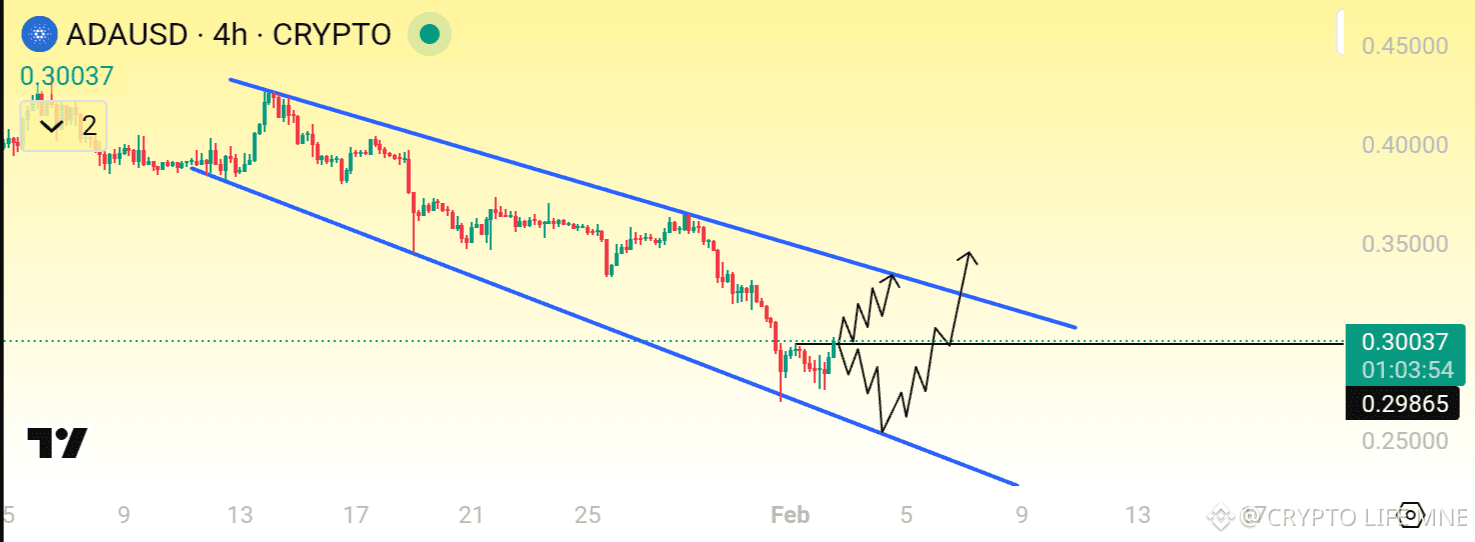
On the 4-hour chart, we can identify a Descending Broadening Wedge pattern. This is a classic bullish formation, and price action is currently consolidating within its ranges.
A successful breakout from this pattern should trigger a recovery, potentially driving the price toward the $0.30 – $0.40 Orderblock Zone.
Final Thoughts
Across all timeframes—short, mid, and long-term—the outlook remains bullish. I am expecting an upward move soon.
Do you agree? Hit the like button if you’re on board, or share your thoughts in the comments below! 👇