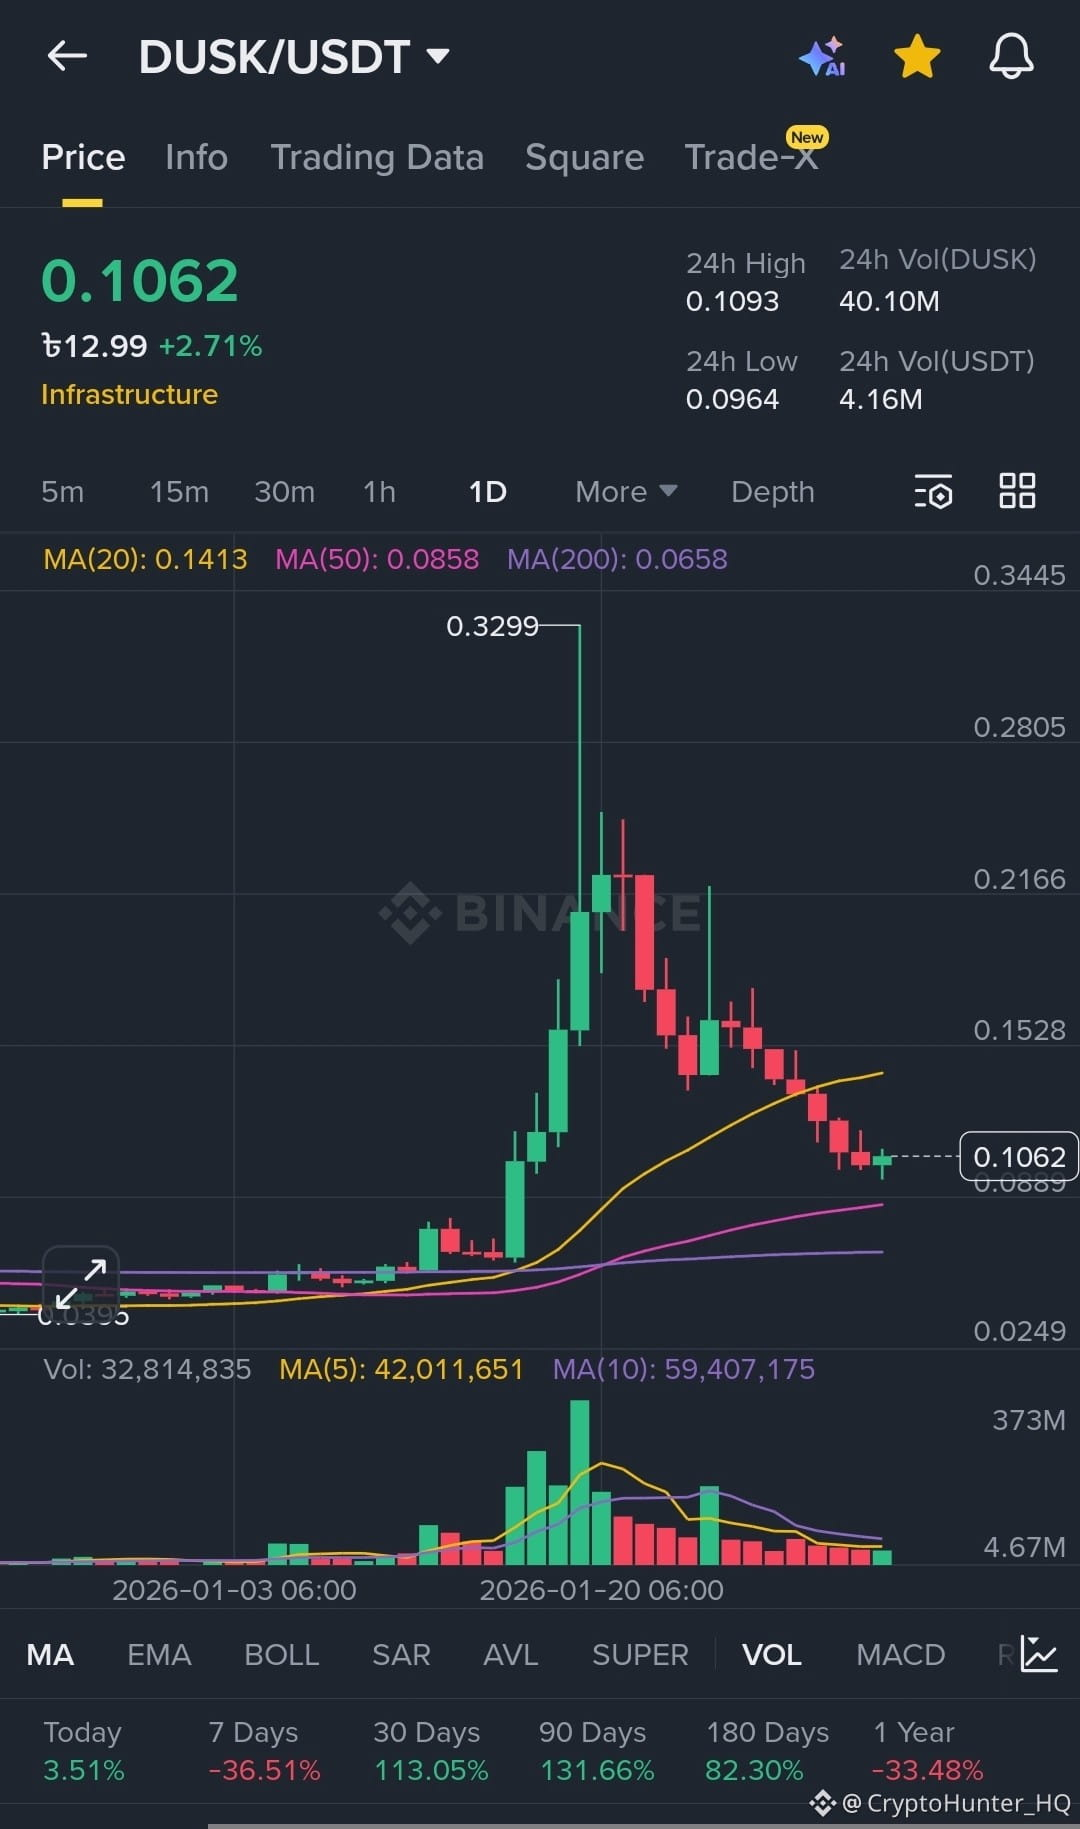
 The $DUSK /USDT daily (1D) chart is currently a perfect example of a market correction after a parabolic move. After gaining over 131% recently, the price is now cooling down to find new support.
Key Market Observations:
1. Healthy Retracement: From the $0.329 peak to the current $0.106 level, this correction is steep but healthy. Note that the 30-day growth is still a massive +113%.
2. MA 50 Support: Price is currently testing support near the Daily 50 Moving Average (MA 50). Holding this level is crucial to maintaining the mid-term bullish structure.
3. Volume Analysis: Trading volume is gradually decreasing on red days, which often indicates that the selling pressure is exhausting and buyers might step in soon.
Strategy: New entries can be considered in small ladders near the current support. However, a daily close below $0.096 would invalidate the immediate bullish setup. 📈🔥
(NFA: Not Financial Advice. Always manage your risk.)