🔥 Why ZIL Pumped (Real Reasons)
1️⃣ Higher-Timeframe Accumulation (Weekly)
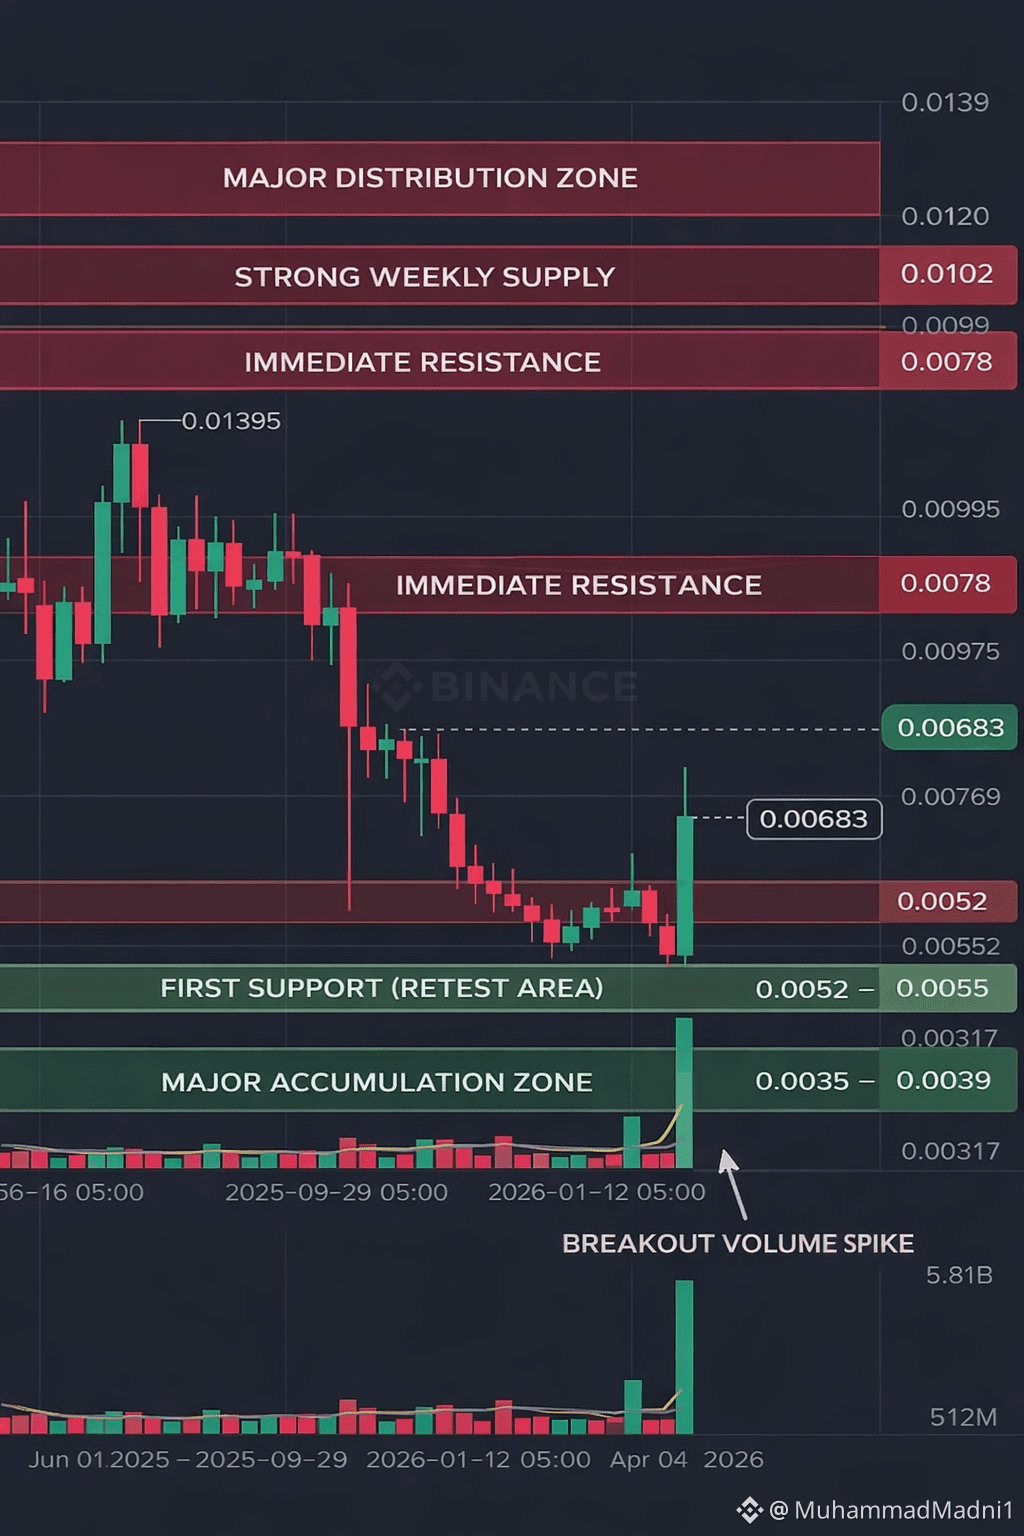
ZIL was in a long downtrend from ~0.0139 → 0.0036
Around 0.0035–0.0038 price formed a base
This zone acted as historical demand (smart money accumulation)
📌 Result: Strong hands absorbed all selling pressure
2️⃣ Capitulation → Reversal Signal
That long red wick near 0.0036 = final sell-off
Weak holders exited, liquidity taken
Immediately after → strong bullish candle
📌 Classic Wyckoff Phase C/D behavior
3️⃣ Volume Explosion (Most Important)
Volume jumped to 5.8B+
MA(5) volume crossed above MA(10)
Pump candle closed with high volume + strong body
📌 This confirms real buying, not a fake wick pump
4️⃣ Break of Local Structure
Price broke above:
Short-term lower highs
Minor supply at ~0.0055
This triggered:
Stop losses of shorts
FOMO buy orders
📌 Once structure breaks → momentum kicks in
📊 Key Zones (VERY IMPORTANT)
🟢 Demand / Support Zones
0.0035 – 0.0039 → Major accumulation zone (weekly demand)
0.0052 – 0.0055 → First support after pump (retest area)
🔴 Supply / Resistance Zones
0.0075 – 0.0078 → Immediate resistance (previous structure)
0.0099 – 0.0102 → Strong weekly supply
0.0120 – 0.0139 → Major distribution zone (previous top)
📈 What Happens Next? (Scenarios)
✅ Bullish Continuation
If price:
Holds above 0.0055
Volume stays above average
➡️ Targets:
0.0078
0.0099
0.0120 (only if BTC supports)
⚠️ Healthy Pullback (Normal)
Retrace to 0.0055–0.0052
Buyers step in again
📌 This is good, not bearish
❌ Bearish Case (Invalidation)
Weekly close below 0.0048
Volume dries up
➡️ Then pump becomes a dead-cat bounce
🧠 Smart Money Summary
✔ Accumulation → ✔ Liquidity grab → ✔ Volume confirmation → ✔ Structure break
This is how real pumps start, not memes.

#StrategyBTCPurchase #ZILUSDT #zil #Ziliqa #GoldSilverRebound