I wasted months decorating charts with every indicator TradingView offered. RSI, MACD, Ichimoku clouds a rainbow mess that told me nothing.
Turns out, watching price is more useful than watching lagging math formulas. Who knew?
Price Moves First, Indicators Cosplay Later
Every indicator is just price in a costume. Before RSI crosses 30, price already dropped. Before MACD prints a signal, price already moved.
So I started watching price and asking simple questions: Who's winning? How strong is the move? What happens at key levels?
Reading momentum through candlesticks: Bearish pressure → Bullish momentum → Consolidation
Support and resistance became my foundation not textbook theory, but levels where price actually reacts because the market respects them.
Support and Resistance: Betrayal Included
Support = buyers step in and push price up. It's a floor.
Resistance = sellers step in and push price down. It's a ceiling.
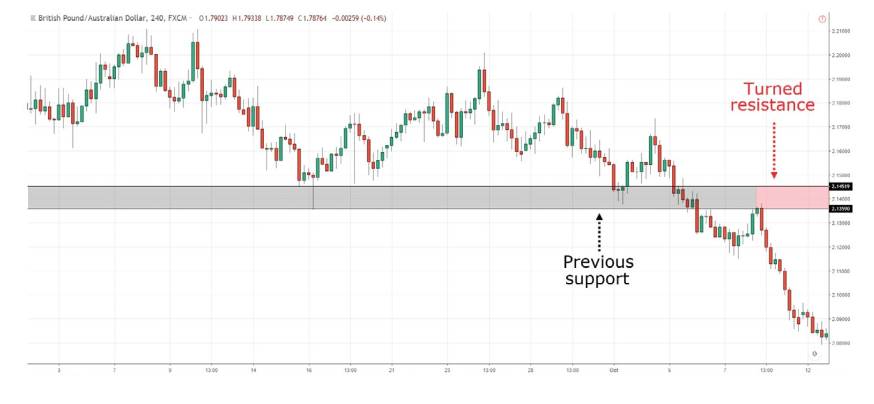
Here's the fun part: these levels switch sides like opportunistic politicians. Support breaks and becomes resistance. Resistance breaks and becomes support.
→ Why Support and Resistance Actually Work
These aren't magic lines. They're psychological and structural zones where:
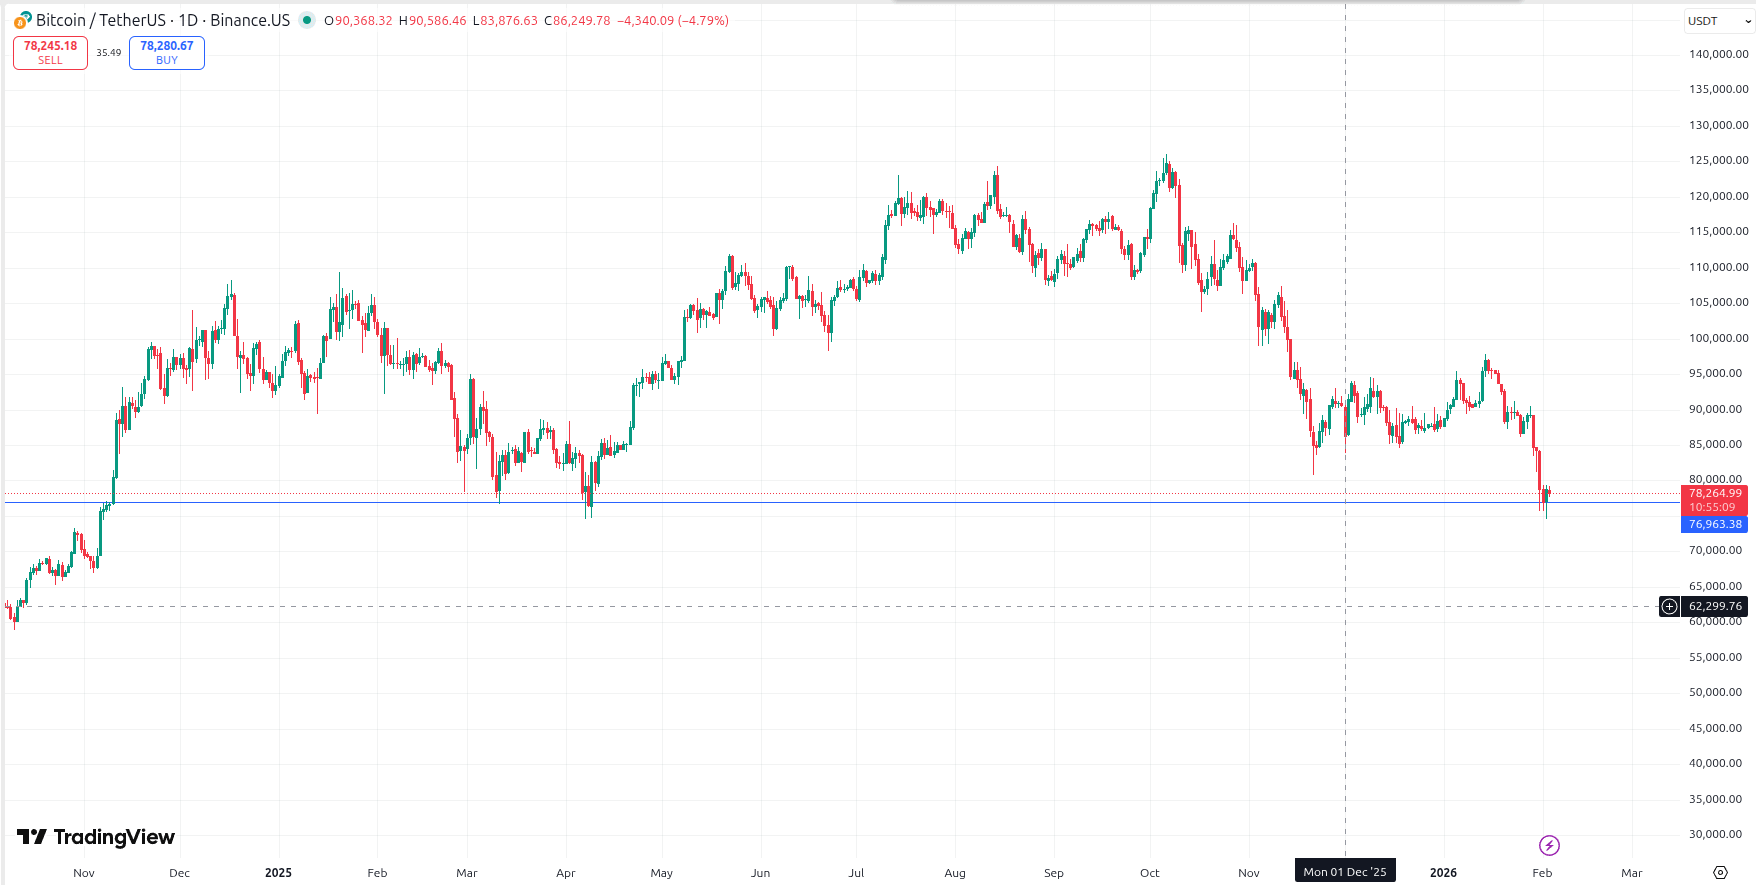
→ Traders remember previous prices. If BTC bounced at $76,000 twice, bulls remember that level worked before. They're more likely to buy again there.
→ Stop losses cluster. Bears who sold at $80,000 placed stops just above. When price breaks through, those stops trigger as buy orders, pushing price higher.
→ Limit orders pile up. At round numbers and key levels, order books show massive limit buy/sell orders waiting.
→ Institutional levels matter. Big players have average entry prices they defend. When price returns to their cost basis, they add to positions.
How I Actually Mark These Levels
I don't draw lines randomly. Here's my process:
→ Multiple touches matter. One bounce could be luck. Two bounces is interesting. Three or more bounces? That's a level the market respects.
→ Price doesn't need to hit exactly. Support isn't a single price it's a zone. BTC might bounce at $76,100, then $75,900, then $76,050. That's still the same $76K support zone.
→ Time adds weight. A level that held for months is stronger than one that held for days. The longer price respects a level, the more significant the eventual break.
→ Volume confirms importance. Heavy volume rejections at a level mean it's defended strongly. Light volume bounces are weaker and more likely to break.
The Support-Resistance Flip Explained
This is where it gets interesting.
Example 1: Support Becomes Resistance
$BTC bounces at $76,000 three times over two weeks. Bulls defend this level hard. Then selling pressure increases, price breaks below $76,000 on high volume, and drops to $74,000.
What happens next?
When price tries to recover and climbs back toward $76,000, it faces resistance. Why?
→ Bulls who bought at $76,000 are now underwater. When price gets back to their entry, they sell to break even.
→ Bears who shorted the break are taking profits at $76,000.
→ New bears see $76,000 as a proven resistance (previous support) and sell there.
That previous support floor just became a resistance ceiling.
Example 2: Resistance Becomes Support
$ETH faces resistance at $3,000. Price gets rejected there twice, dropping back to $2,800 both times. Then momentum shifts. Buyers push through $3,000 on heavy volume and price runs to $3,200.
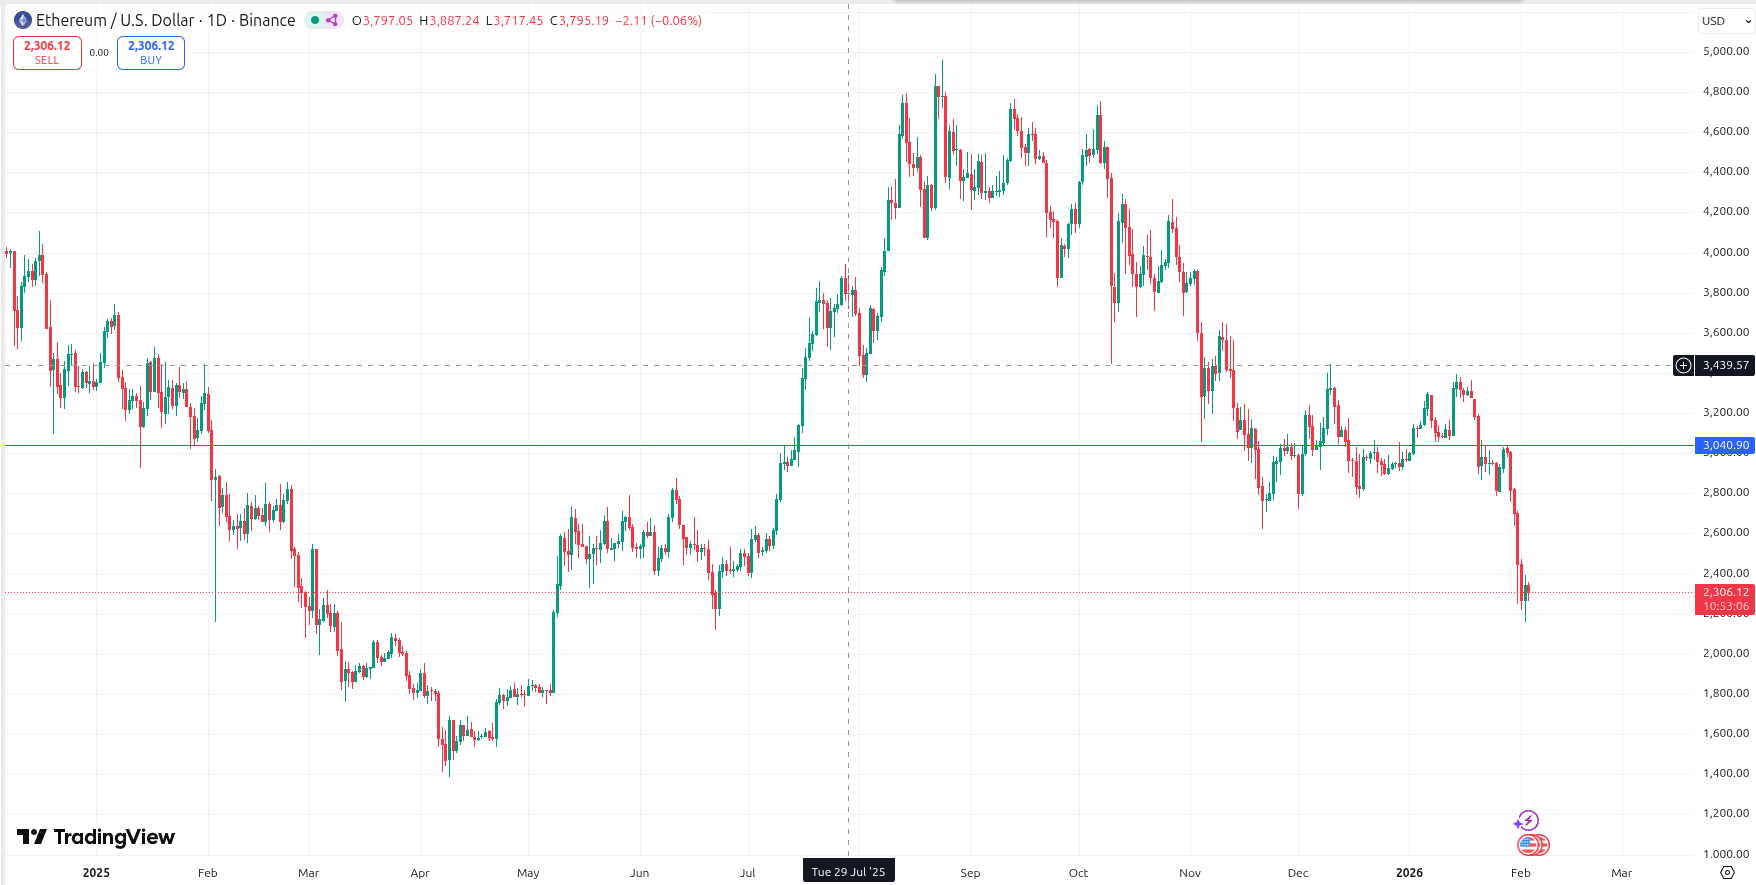
Now price pulls back. What happens at $3,000?
→ Bulls who missed the breakout buy the pullback at the proven level.
→ Bulls who bought the breakout add to positions, defending their entry zone.
→ Bears who shorted at $3,000 covered at a loss. They're out of the picture.
→ New bulls see $3,000 as previous resistance flipped to support.
That ceiling just became a floor.
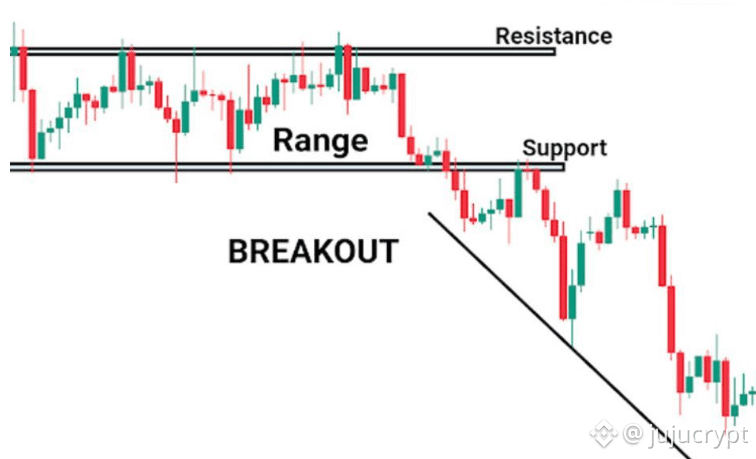
Top: Support becomes resistance after break. Bottom: Resistance becomes support after breakout.
The Retest Is Everything
When a level breaks, the retest tells you if it's real or fake.
Strong break: Price breaks support/resistance decisively on high volume, moves away quickly, then retests the level from the other side. The retest holds (previous support now acts as resistance, or vice versa). This confirms the flip. High probability setup.
Weak break (fakeout): Price barely breaks through on low volume, doesn't move far, and quickly reverses back through the level. This means the break failed. The original level still holds.
I wait for the retest before entering. It's the difference between catching a real trend change and getting faked out.
Levels That Actually Matter
Horizontal Levels – Multiple reaction points. These have proven themselves.
Swing Highs/Lows – Previous battle zones with historical context. More reliable than random round numbers.
Psychological Levels – Round numbers ($50K, $100K). Humans love round things. Order books pile up here.
Moving Averages – 50 MA and 200 MA on daily charts. When price respects them, they matter. When it doesn't, I pretend they don't exist.
Trendlines – Price + time + momentum. Shows the slope and strength of a trend, not just a static price point.
Trendlines: Support and Resistance With Attitude
Trendlines are dynamic levels that move with price. Unlike horizontal support/resistance which are static, trendlines show you the slope, speed, and strength of momentum.
How to Draw Trendlines Properly
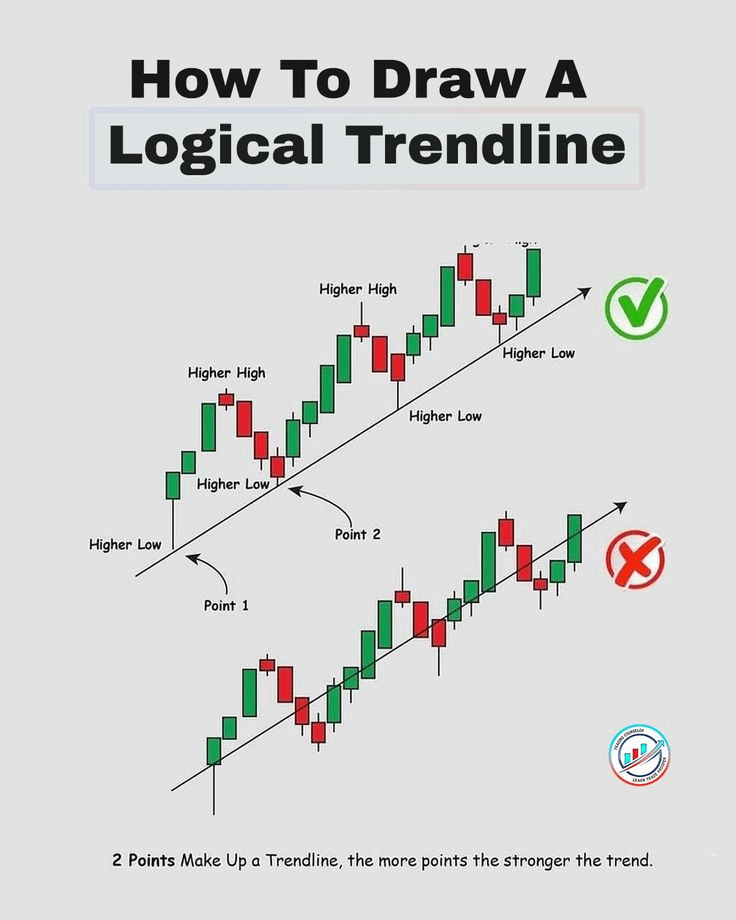
For uptrends: Connect at least two higher lows with a straight line extending forward. The line acts as dynamic support.
For downtrends: Connect at least two lower highs with a straight line extending forward. The line acts as dynamic resistance.
Key rules I follow:
1. Need at least 3 touches for confirmation. Two points make a line. Three touches confirm the market respects the trendline.
2. Don't force the line. If you're twisting your chart to make touches fit, the trendline isn't valid.
3. Wick touches count. Price doesn't need to close on the line. Wicks testing and rejecting the trendline are valid touches.
4. Steeper = weaker. Aggressive trendlines (steep angles) break faster. Gradual trendlines show sustainable momentum.
Trendlines tell you more than just direction they tell you the story of momentum.
Candlesticks Need Context or They're Useless
For months I thought candlestick patterns were magic. "Hammer = buy!" Yeah, no.
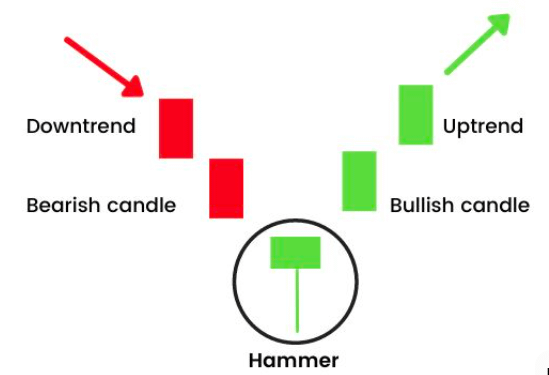
Hammer at support in a downtrend = buyers rejected lower prices. Hammer in the middle of nowhere = just Tuesday.
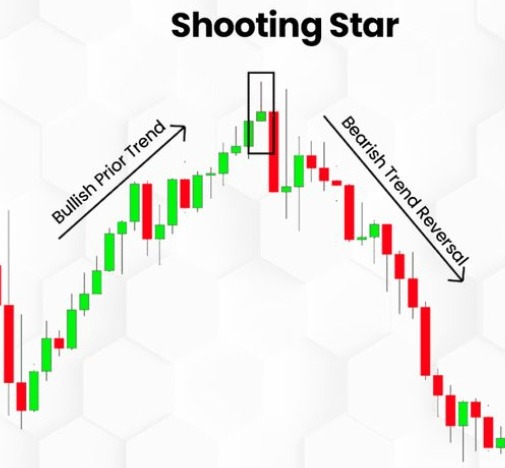
Shooting star at resistance in an uptrend = sellers taking control. Shooting star mid-range = noise.
Dojis/spinning tops = indecision. Only relevant near key levels. Everywhere else, they're just candles having an identity crisis.
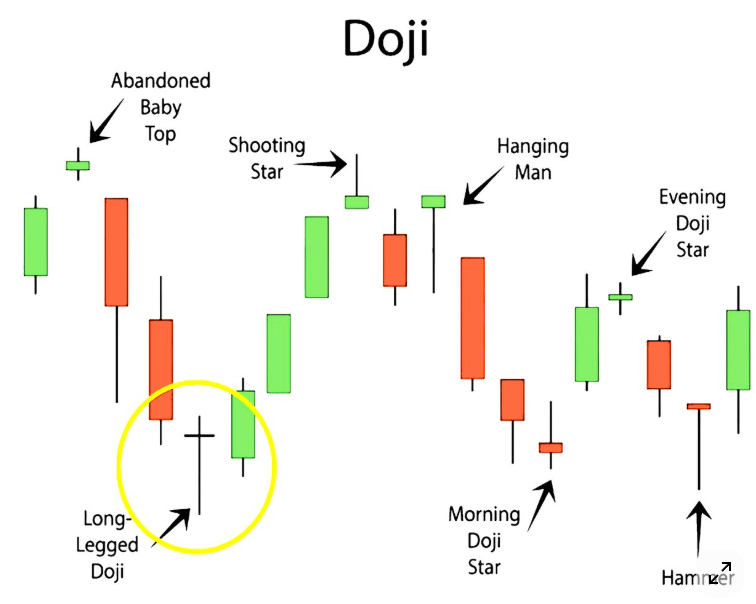
Hammer at support (bullish reversal), Shooting star at resistance (bearish reversal), Doji at key level (indecision)
Real Trade I Took (And Didn't Screw Up)
BTC approached $76,000 support on 4H:
1. Level: Two prior bounces here. Proven support.
2. Volume: Selling pressure fading as price neared $76K.
3. Candle: Hammer formed at support with long lower wick.
4. Confirmation: Next candle closed green, volume increased.
Entry: Above hammer high. Stop: Below $75,500. Target: $78,500.
Result: Hit target.
Early mistake: I used to enter on the hammer alone. No confirmation, just vibes. Got wrecked repeatedly before learning to wait one candle. Patience isn't "missing the move"it's not being stupid.
Daily Process
1. Watch price on 1H, 4H, daily charts.
2. Mark support/resistance at actual reaction zones.
3. Draw trendlines for momentum structure.
4. Observe candle behavior at levels + volume.
5. Ask: Who's winning? Momentum continuing or dying?
Some days I'm right. Some days the market reminds me I'm still learning.
What Actually Matters
TA isn't about predicting the future. It's about reading context, managing risk, and not forcing trades out of boredom. Support, resistance, and trendlines build that context.
I'm still learning. Still making mistakes. Still getting humbled.
But at least now I know why I'm wrong. Progress.