In the world of trading, Fibonacci Retracement is a powerful tool for spotting hidden support and resistance levels. It’s built on a simple truth: “Markets don’t move in straight lines. They move in waves—pulling back, then continuing the trend.”
1. How Fibonacci Works?
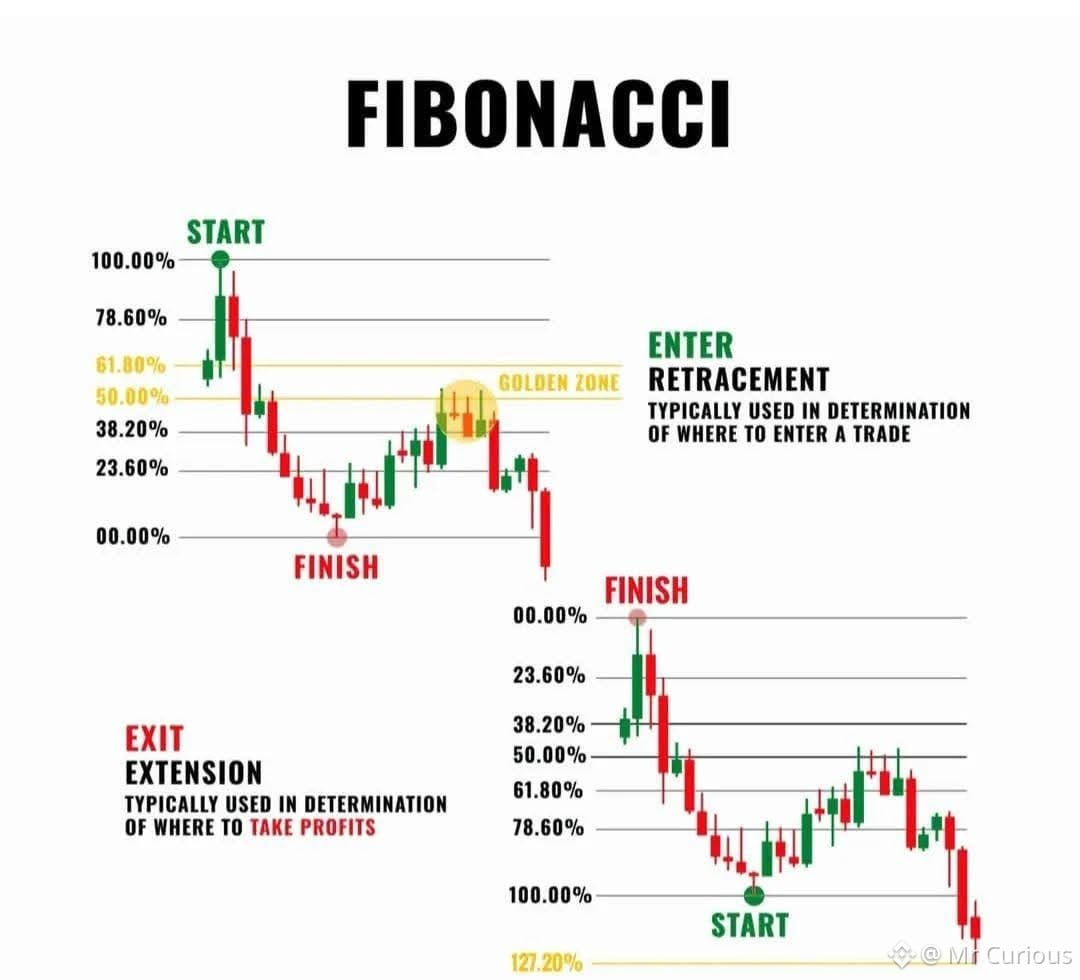
Traders mark two key extremes on the chart—a major high and a major low—and divide that move using Fibonacci ratios: 23.6%, 38.2%, 50%, 61.8%, and 78.6%.
The Golden Pocket: The zone between 61.8% and 65% is considered the most important area, where price reversals often occur.
The 50% Level: Not a true Fibonacci ratio, but widely respected because markets frequently retrace half of a move before continuing.
2. Using Fibonacci in a Trading Strategy
Fibonacci levels are not buy-or-sell signals by themselves. They work best when combined with other confirmations.
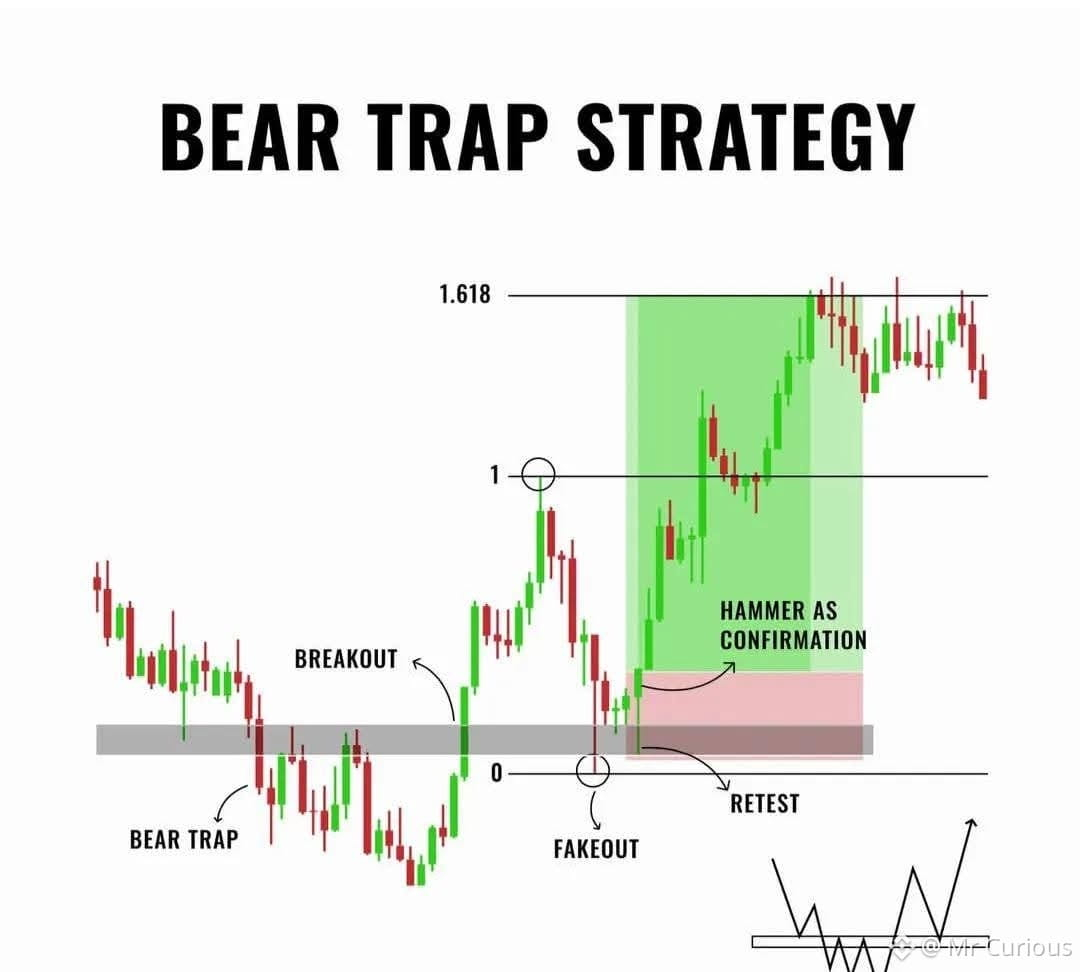
In an uptrend: Price pulls back from a high. If it reaches the 61.8% level and forms a bullish candle (like a Hammer or Engulfing), it often signals a high-probability buy.
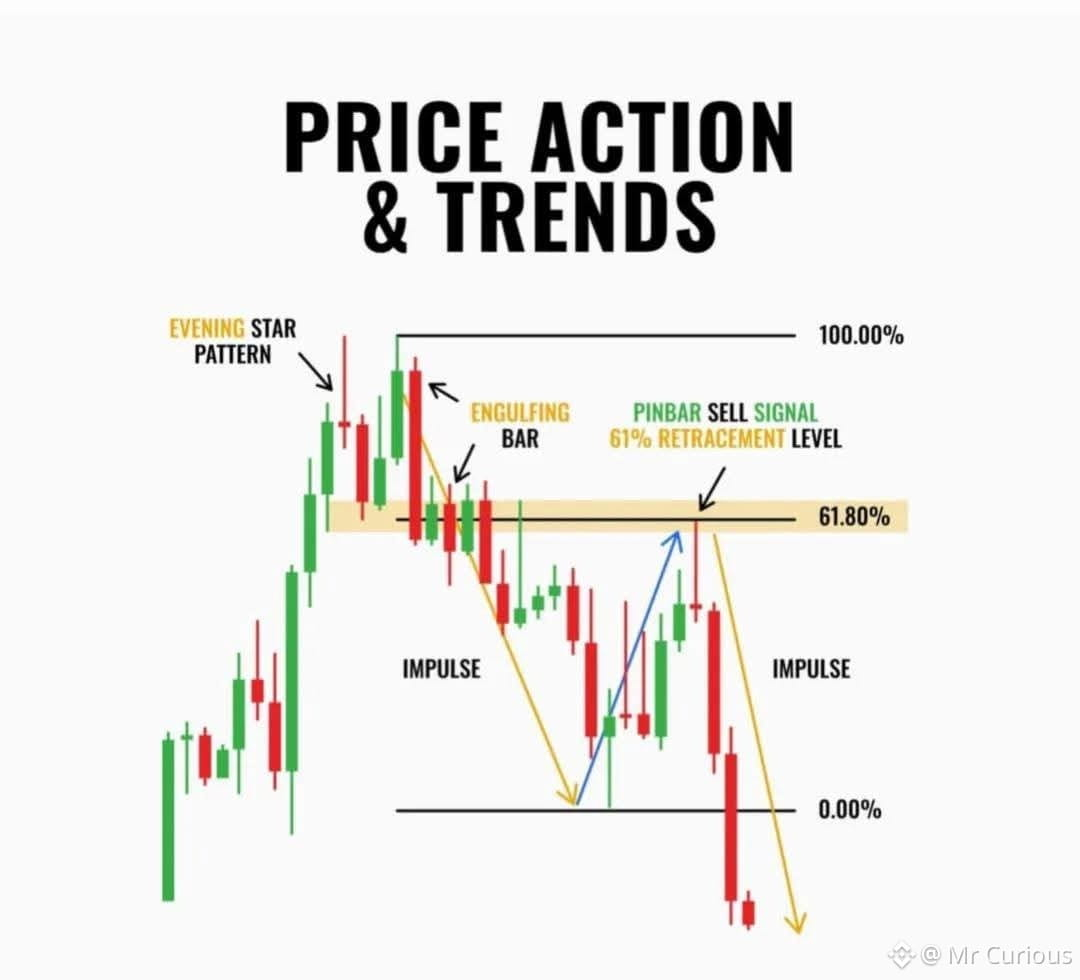
In a downtrend: Price rallies into a level such as 38.2%. If it shows weakness or rejection there, it can be a good opportunity to sell or short, expecting the trend to continue lower.
3. Fibonacci Extensions (Targets & Take Profit)
Retracements help with entries, while Extensions help define targets. Common levels like 161.8% and 261.8% show where the next impulsive move may reach, making them ideal zones to take profits.
4. Important Realities to Remember
Self-fulfilling effect: These levels work partly because so many traders watch them. When large orders cluster around 61.8%, price often reacts.
Timeframe matters: Fibonacci levels on higher timeframes (Daily, 4H) are far more reliable than those on very low timeframes, which are often dominated by noise.
Fibonacci doesn’t predict price — it highlights where smart money pays attention.