Current price (approx):
• ~0.0037–0.0049 USDT per G token on major exchanges. 
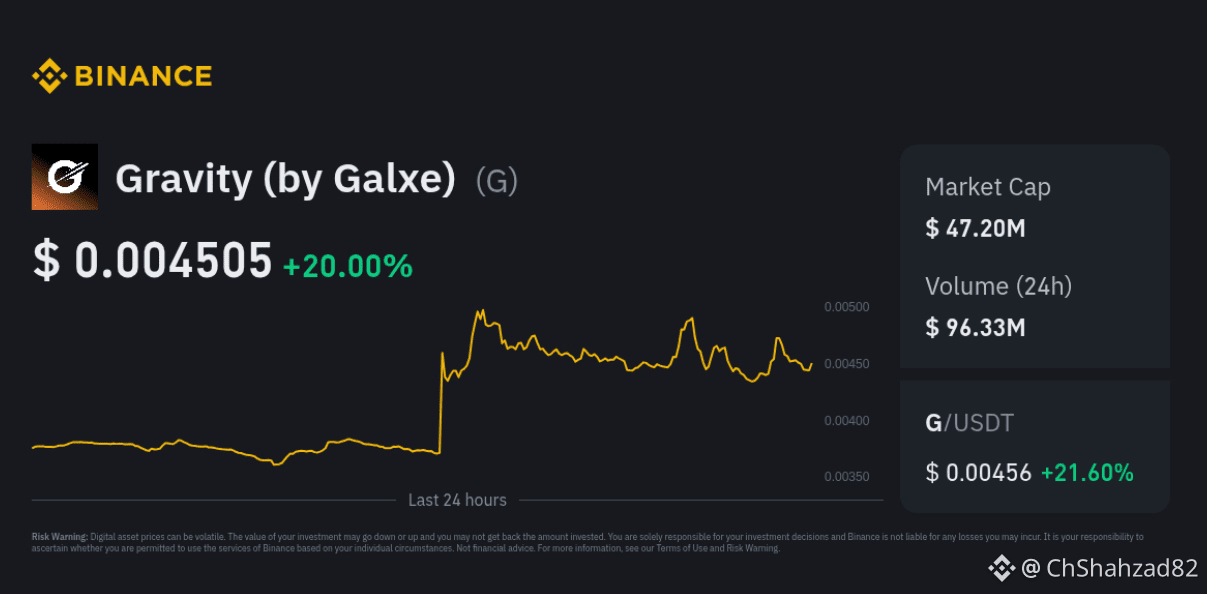
• CoinMarketCap shows around ~0.0045 USD per G in recent data. 
24-hour price range:
• Typical recent range: ~0.0036 — 0.0050 USDT. 
24h price change direction:
• Some sources show recent gains up to +20–27%, while others show mild declines — likely reflecting different exchange data timing. 
Short-term trend (7d):
• Mixed: small weekly gains in some data, slight declines in others — overall sideways to mildly bullish. 
Long-term (30d / 1y):
• Gravity remains significantly below past highs (over 90% under its 2024 peak price). 
• Over the past year, price is down materially — typical for many low-cap altcoins in downturns. 
⸻
📉 Chart Interpretation (Technical Snapshot)
While I can’t show the chart image here, most live chart data shows:
Support Levels (approx):
• Around ~0.0036–0.0039 USDT — recent lows where buyers stepped in. 
Resistance Levels (approx):
• Around ~0.0050 USDT — recent upper range, where selling pressure grew. 
Trend Notes:
• Volatility is high, with swings inside the range above.
• On shorter timeframes (1–4h), prices can show short upticks, but larger trend still range-bound. 
Technical signals (mix):
• Some platforms label short-term as buy due to bounce patterns, but weekly and monthly momentum remains weak, typical of low liquidity altcoins. 
⸻
🧠 Market Context Quick Notes
• G is a utility token for the Gravity blockchain by Galxe, used in governance/staking. 
• Crypto markets overall are volatile — with larger tokens like BTC/ETH strongly influencing sentiment for smaller assets.
⸻
📈 What Traders Are Watching
Bullish signs
• Break above recent resistance (~0.0050 USDT).
• Increase in volume — indicates fresh buying interest.
Bearish risks
• Price failing at resistance and dropping toward support.
• Broader crypto downturn or major news affecting sentiment.
#TrumpProCrypto #TrumpEndsShutdown