
1️⃣ Macro Pressure & Liquidity Shift
Bitcoin’s drop wasn’t random. It came during a period of:
Aggressive profit-taking in gold and silver
Liquidity rotation from crypto into metals
Broad weakness across U.S. equity markets
Rising geopolitical tension (U.S. – Iran uncertainty)
Tariff and political headlines triggering risk-off sentiment
When global markets shift to defensive assets, crypto usually reacts first and faster.
2️⃣ Liquidity Drought
This move was amplified by:
Weak ETF inflows
Reduced institutional demand
Miner distribution pressure
Low spot demand during breakdown
Bitcoin doesn’t usually collapse this fast unless liquidity is thin.
This was a liquidity-driven flush, not just technical weakness.
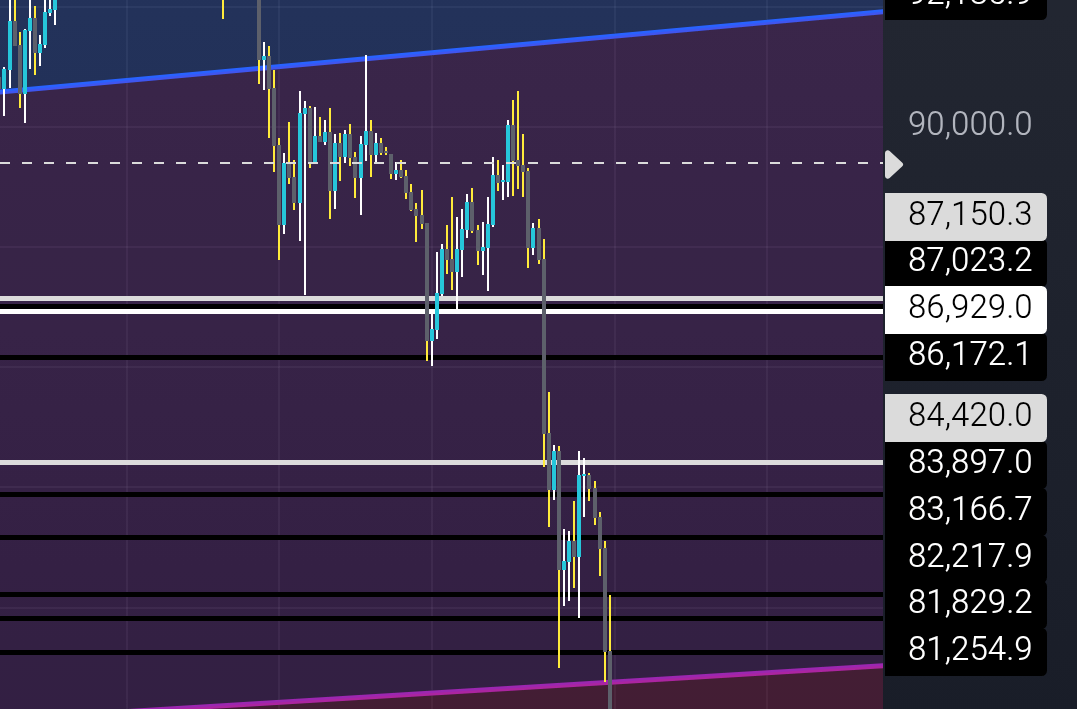
3️⃣ Market Structure Breakdown
The range between 85,000 – 92,000 was a compression zone.
Once that structure failed:
90,000 (major breakout level) failed
88,000–90,000 rejection confirmed weakness
87,000 lost multiple times
84,000 → 80,000 cascade followed
Repeated retests weaken support.
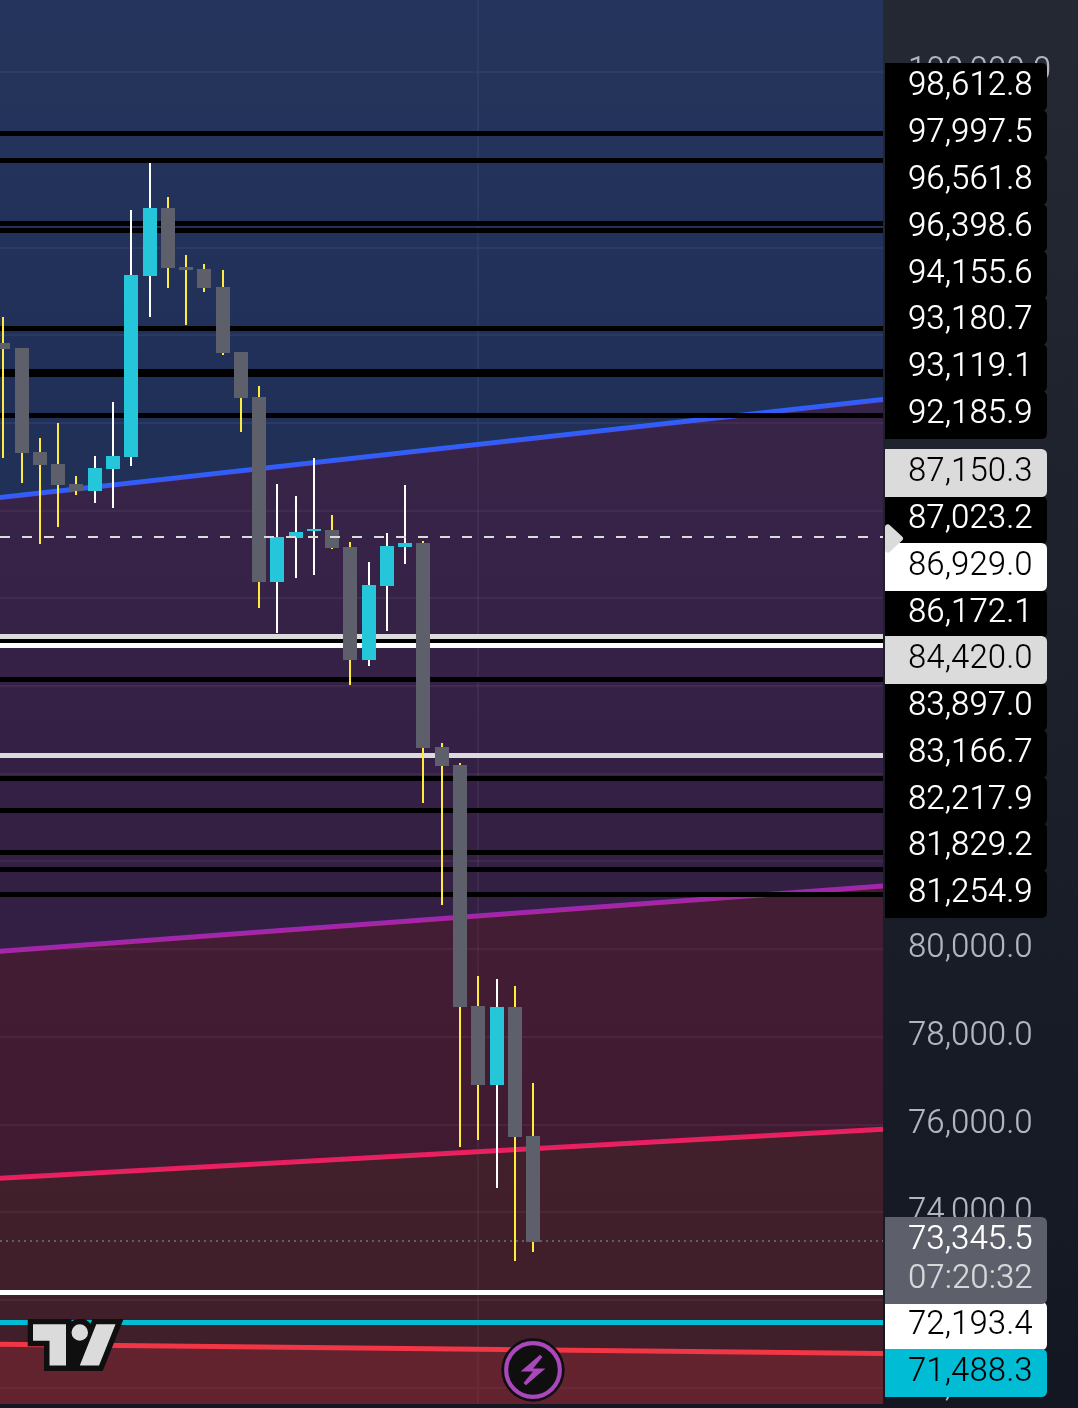
The final break below 87K triggered acceleration toward 72K.
Technical Structure Analysis
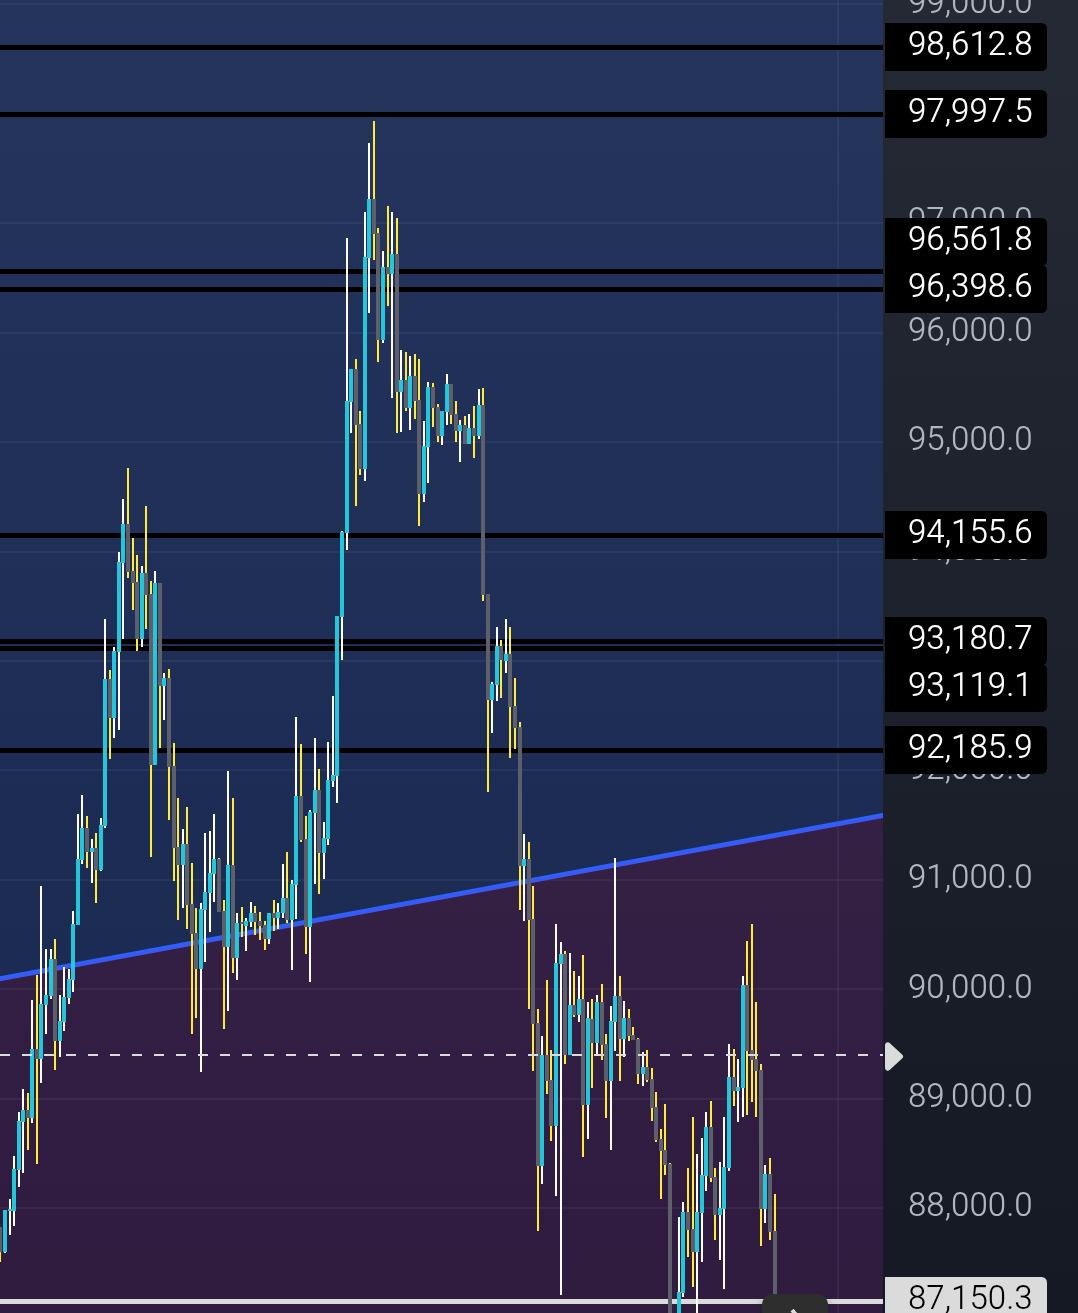
🔹 Zone 1: 97,800 – 90,000
97,000–98,200 → Failed breakout zone
96,000–94,000 → Neutral transition range
94,100 / 93,200 / 92,250 → High volatility cluster
91,500 → First reaction support
90,000 → Psychological & structural level
Failure at 90K shifted control to sellers.
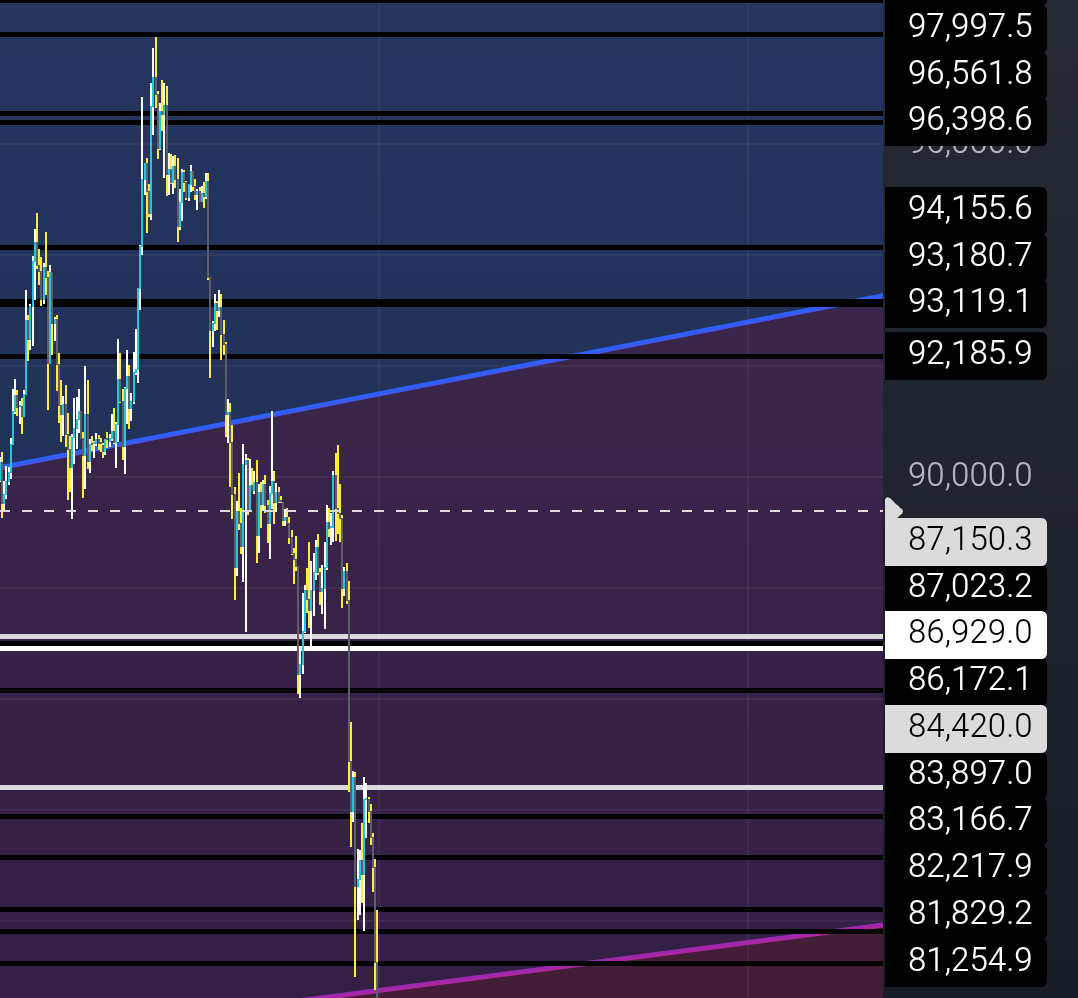
🔹 Zone 2: 90,000 – 80,000
88,000–90,000 → Major rejection band
87,000 → Multiple rebounds (5–6 times)
Final breakdown → 84,000
80,000 → Temporary bounce
Fourth retest failure → Acceleration below 80K
Repeated support tests = structural exhaustion.
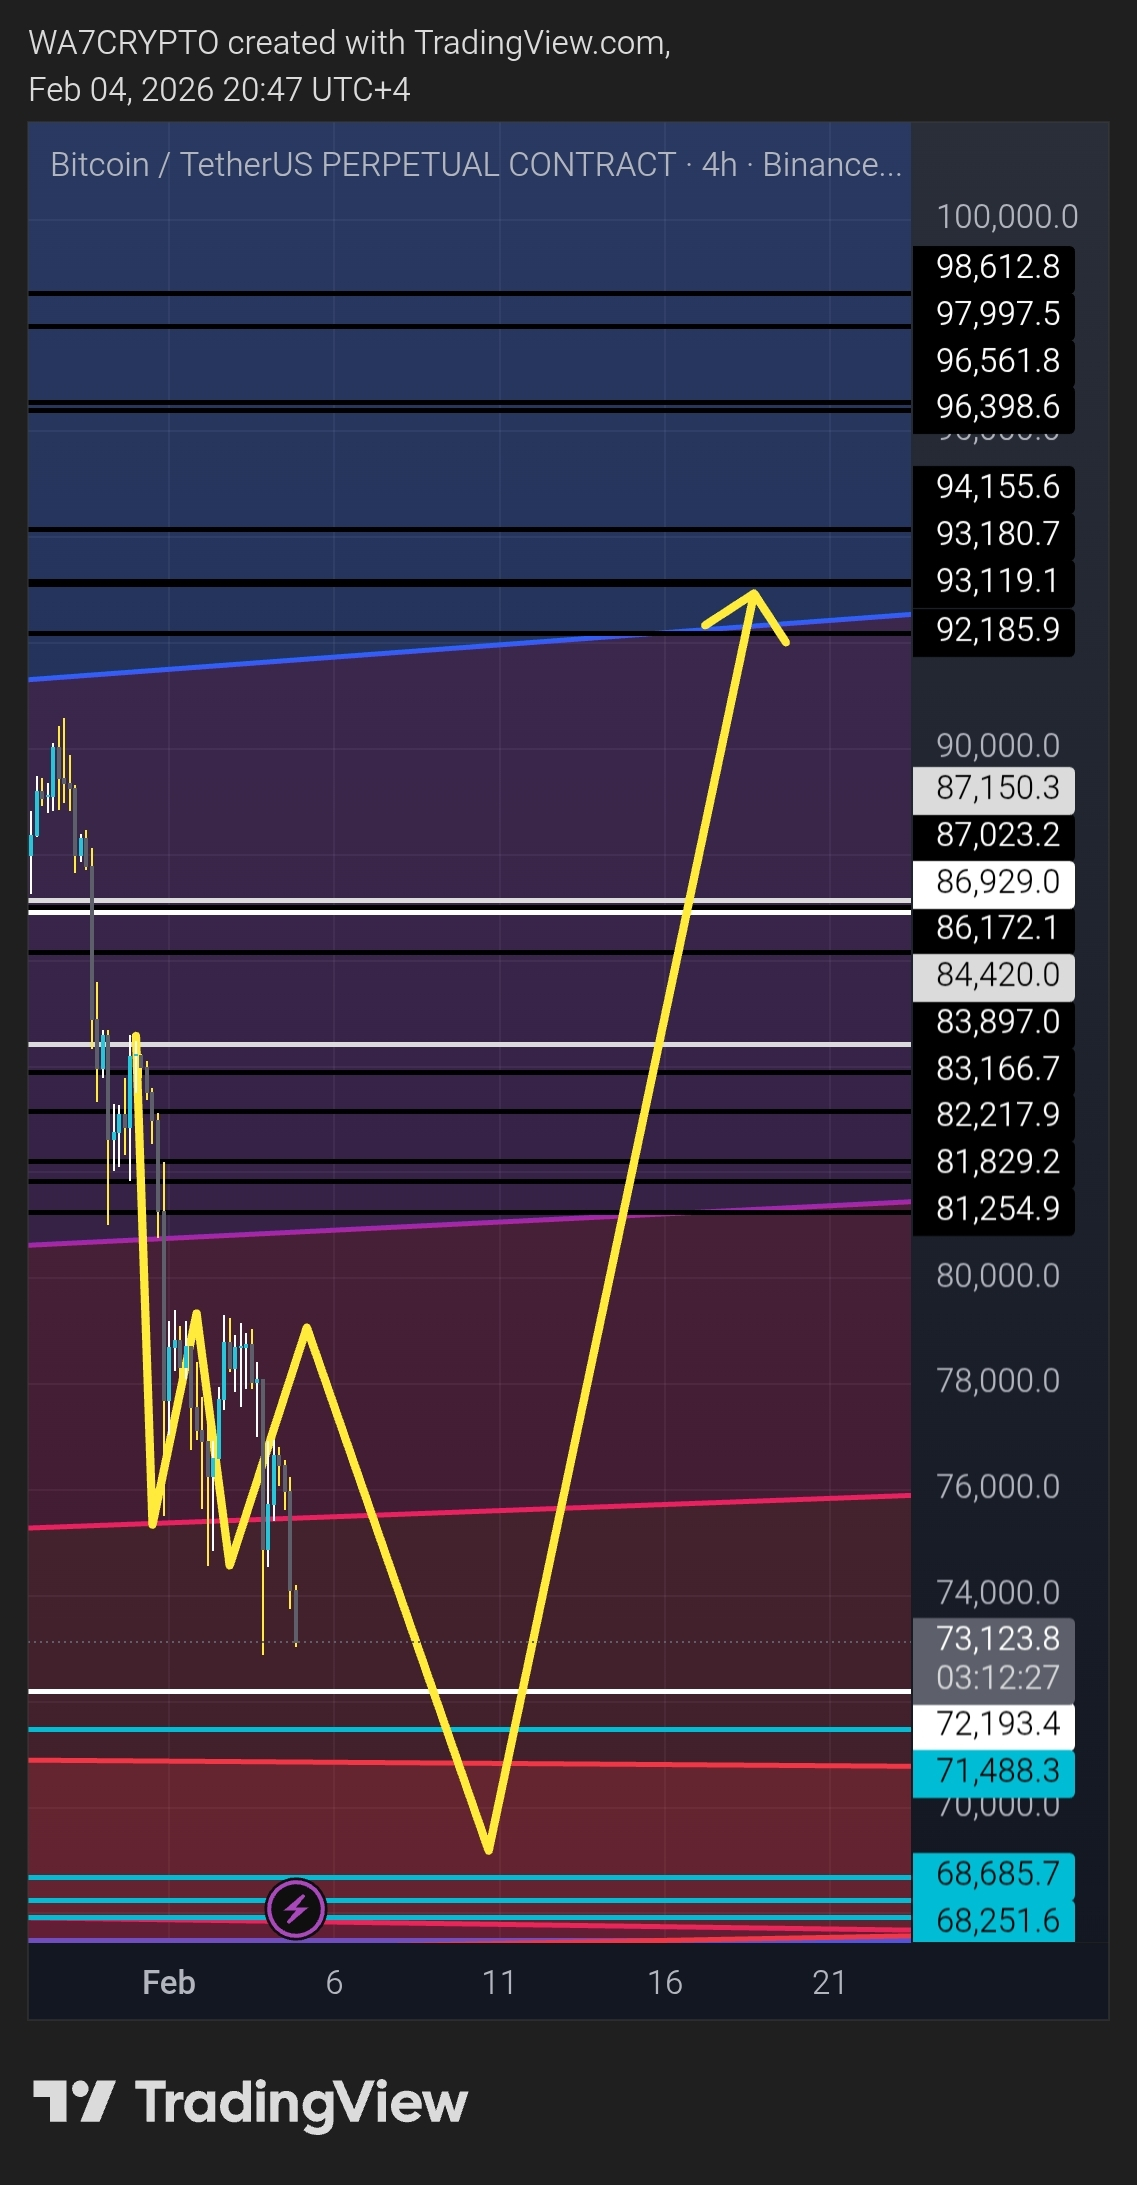
🔹 Zone 3: 74,400 – 70,000
This zone is structurally interesting because:
It was previously a base for the breakout toward 100K
Liquidity pockets remain thin
No strong trend lines currently visible
Violent drop increases probability of relief bounce
Potential reaction range: 70,000 – 79,000

Current Market Psychology
Extreme fear phase
Altcoins heavily compressed
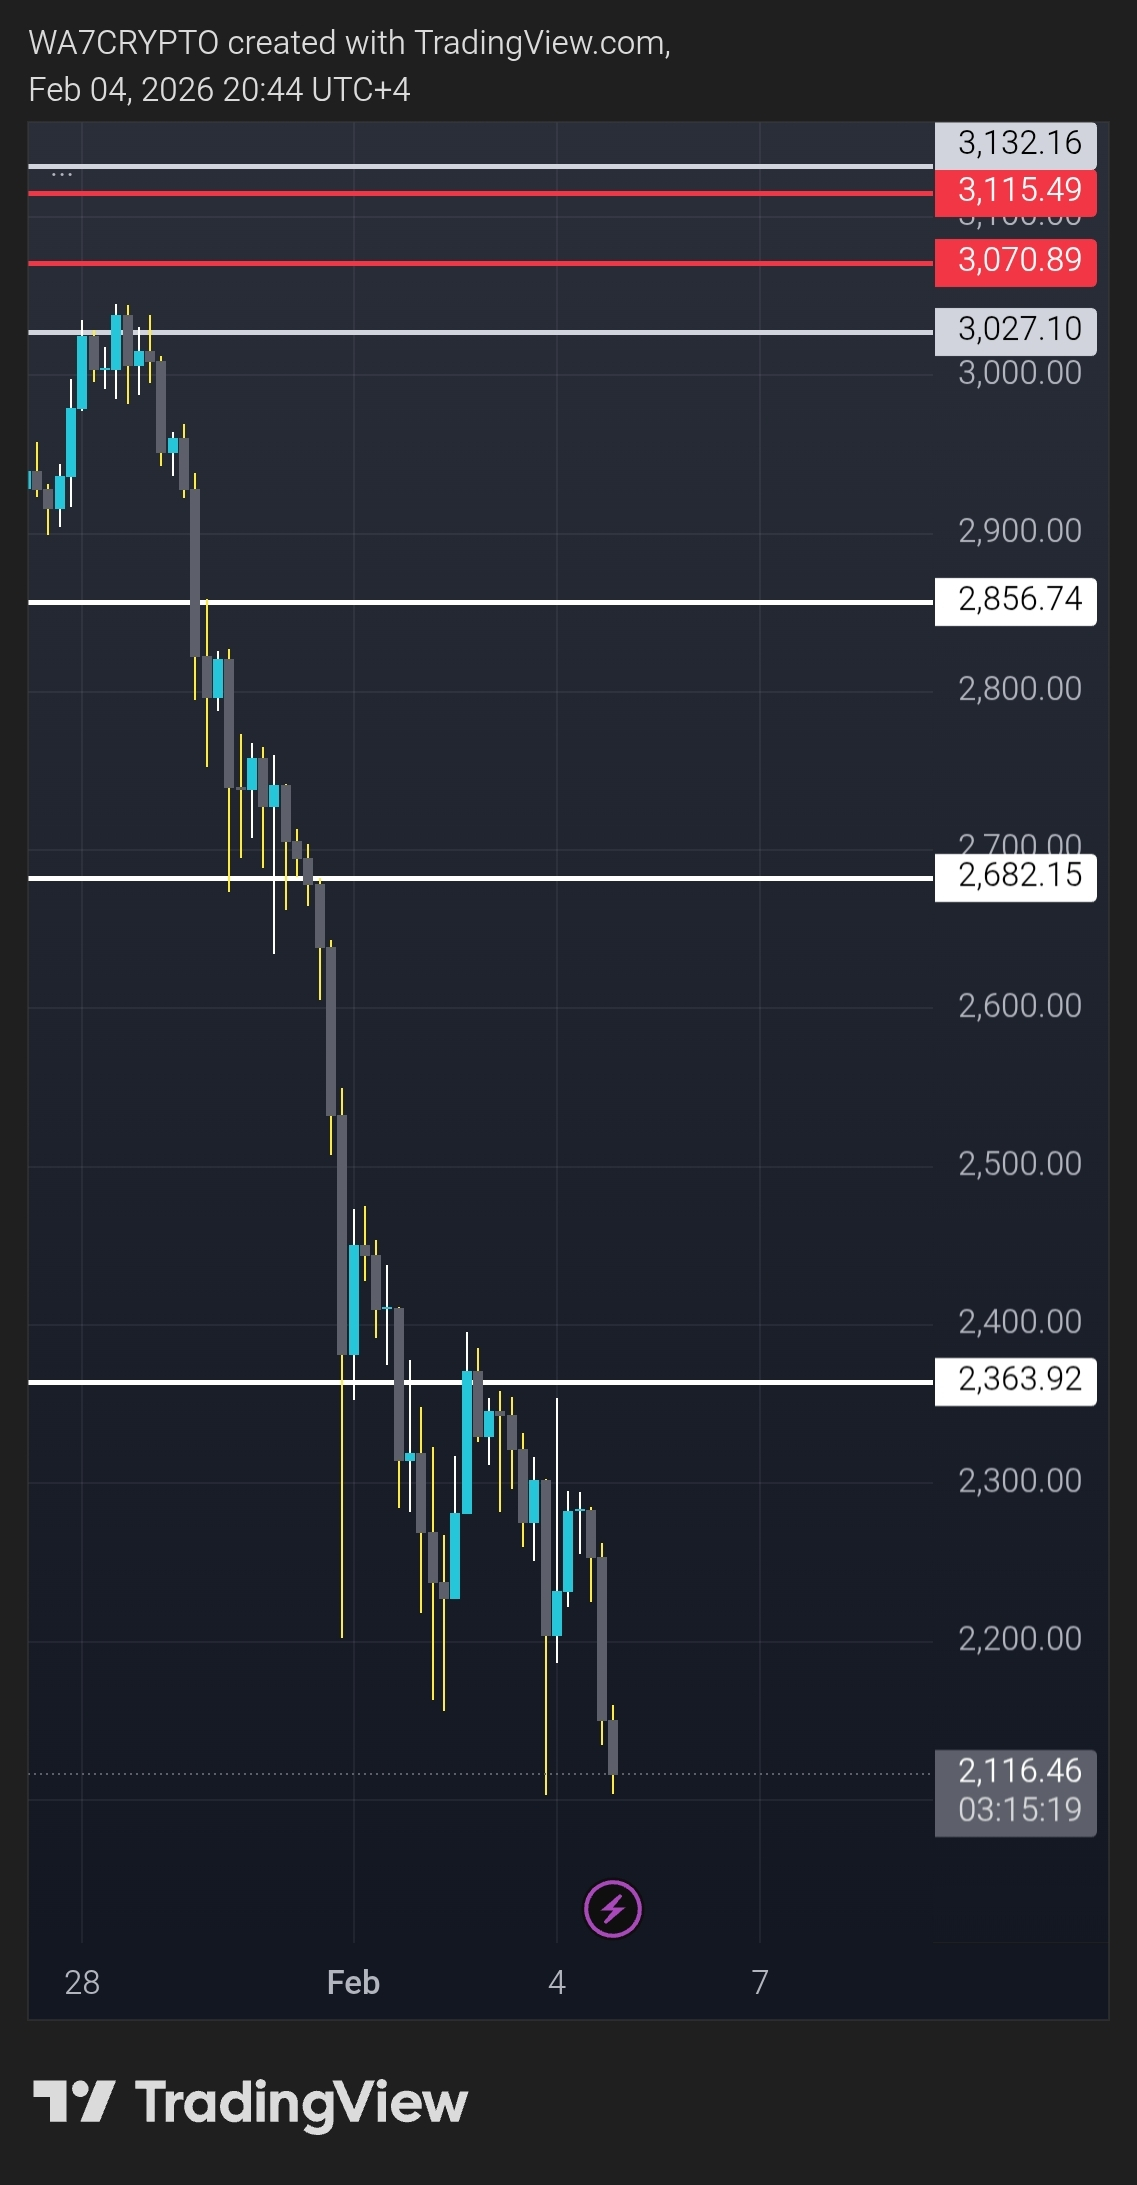
ETH near 2,000
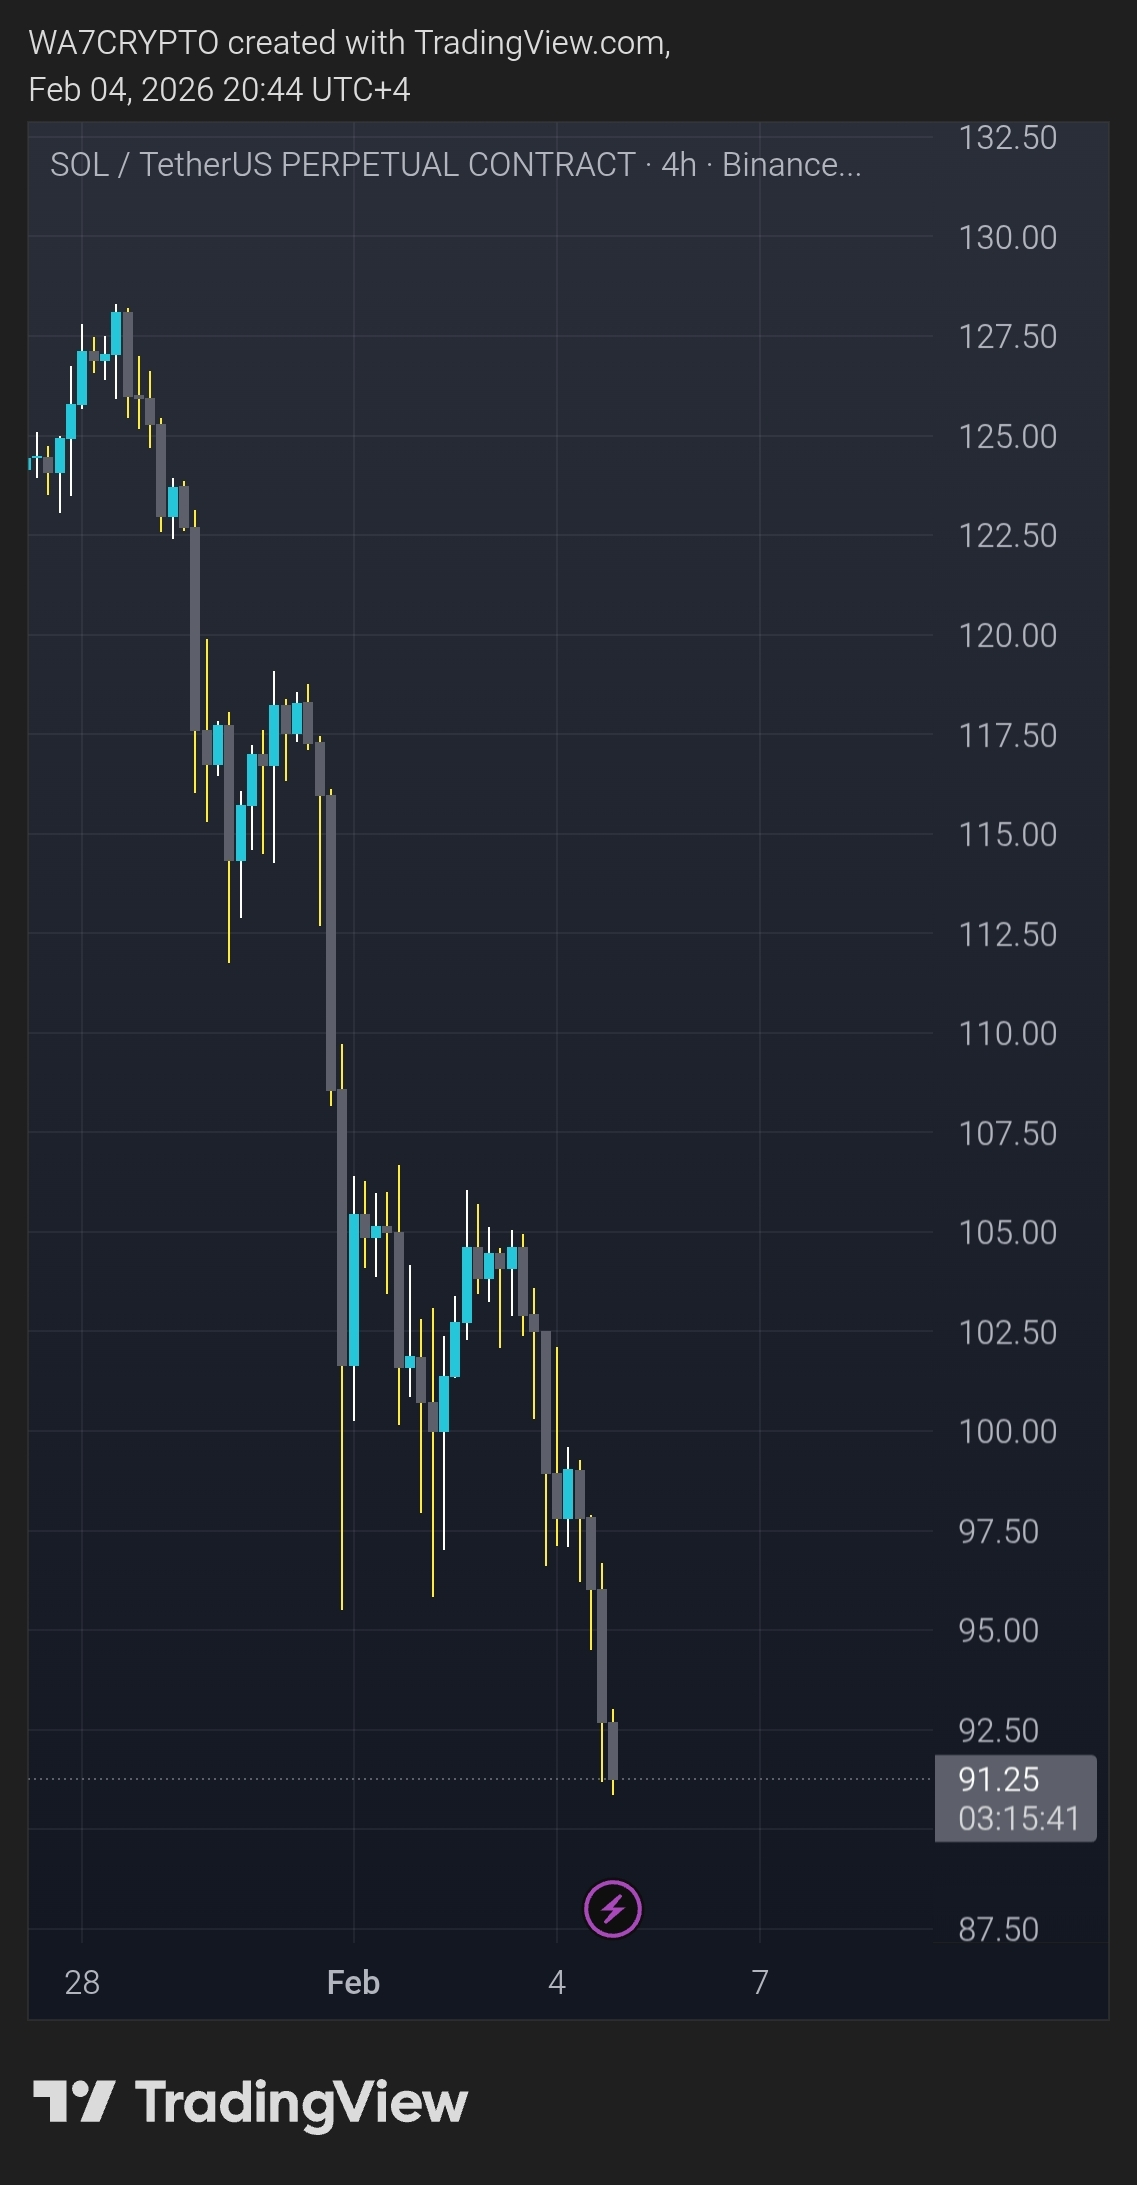
SOL below 100
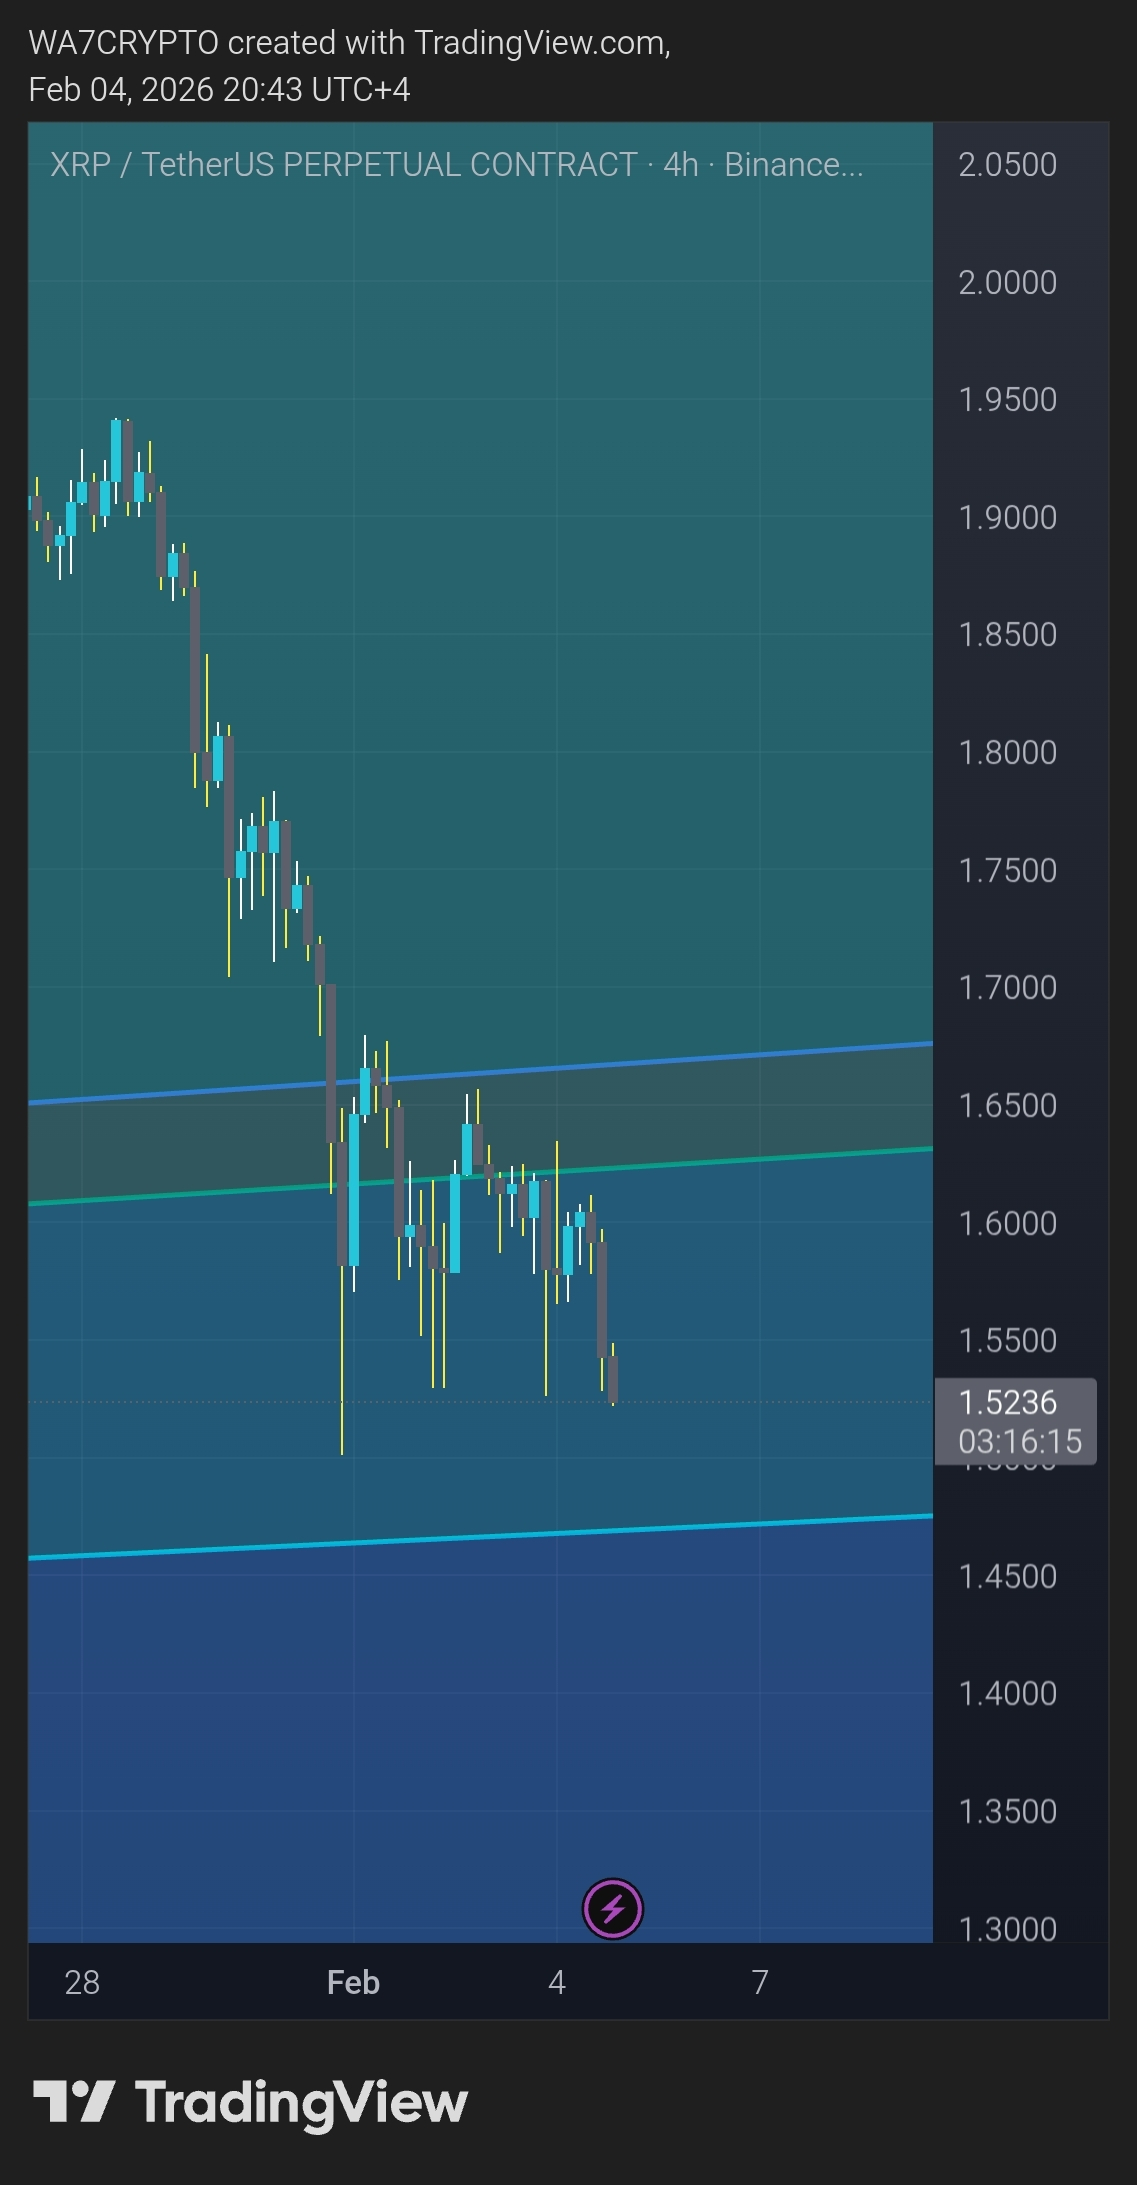
XRP below 1.6
When majors compress this hard, market enters high-volatility expansion phase.
Forward Outlook
Two scenarios:
Scenario A – Relief Bounce
If liquidity returns and macro stabilizes:
80K reclaim
85K retest
90K possible again
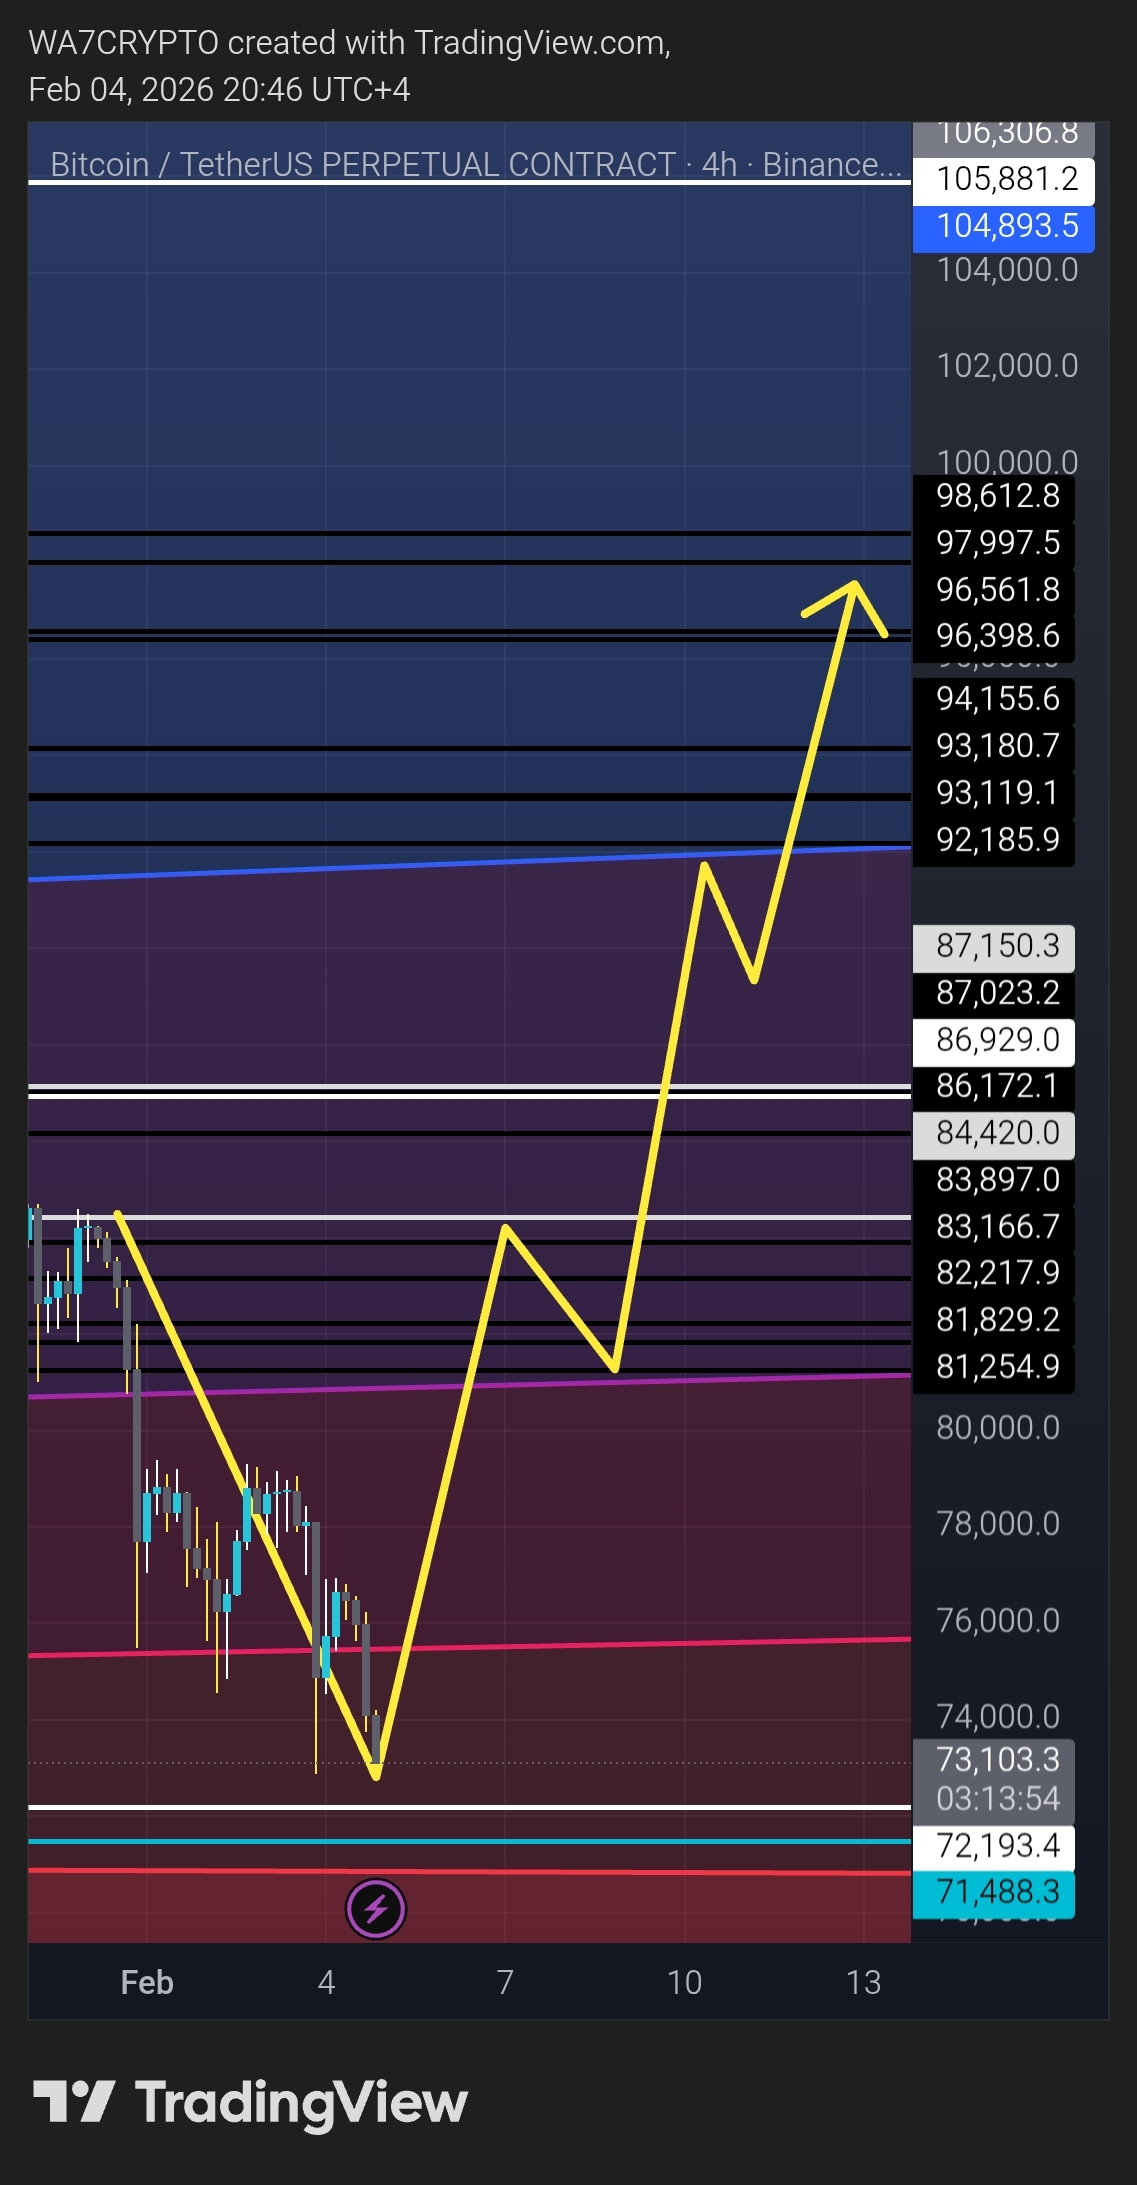
Scenario B – Continued Risk-Off
If geopolitical or macro stress increases:
70K retest
Temporary liquidity sweep
Deeper consolidation before recovery
Final
This wasn’t just a technical drop.
It was a liquidity-driven macro reaction amplified by structural weakness.
However, sharp drops often create sharp rebounds.
The next move depends heavily on liquidity return and macro stability.