Most people think trading requires years of experience.
In reality, clarity beats complexity.
With 5-minute candlestick charts, beginners can learn to read price behavior, take quick decisions, and aim for small, repeatable wins — the kind that build confidence before size.
🕒 What Is a 5-Minute Candlestick Chart?
Each candle represents 5 minutes of market activity:
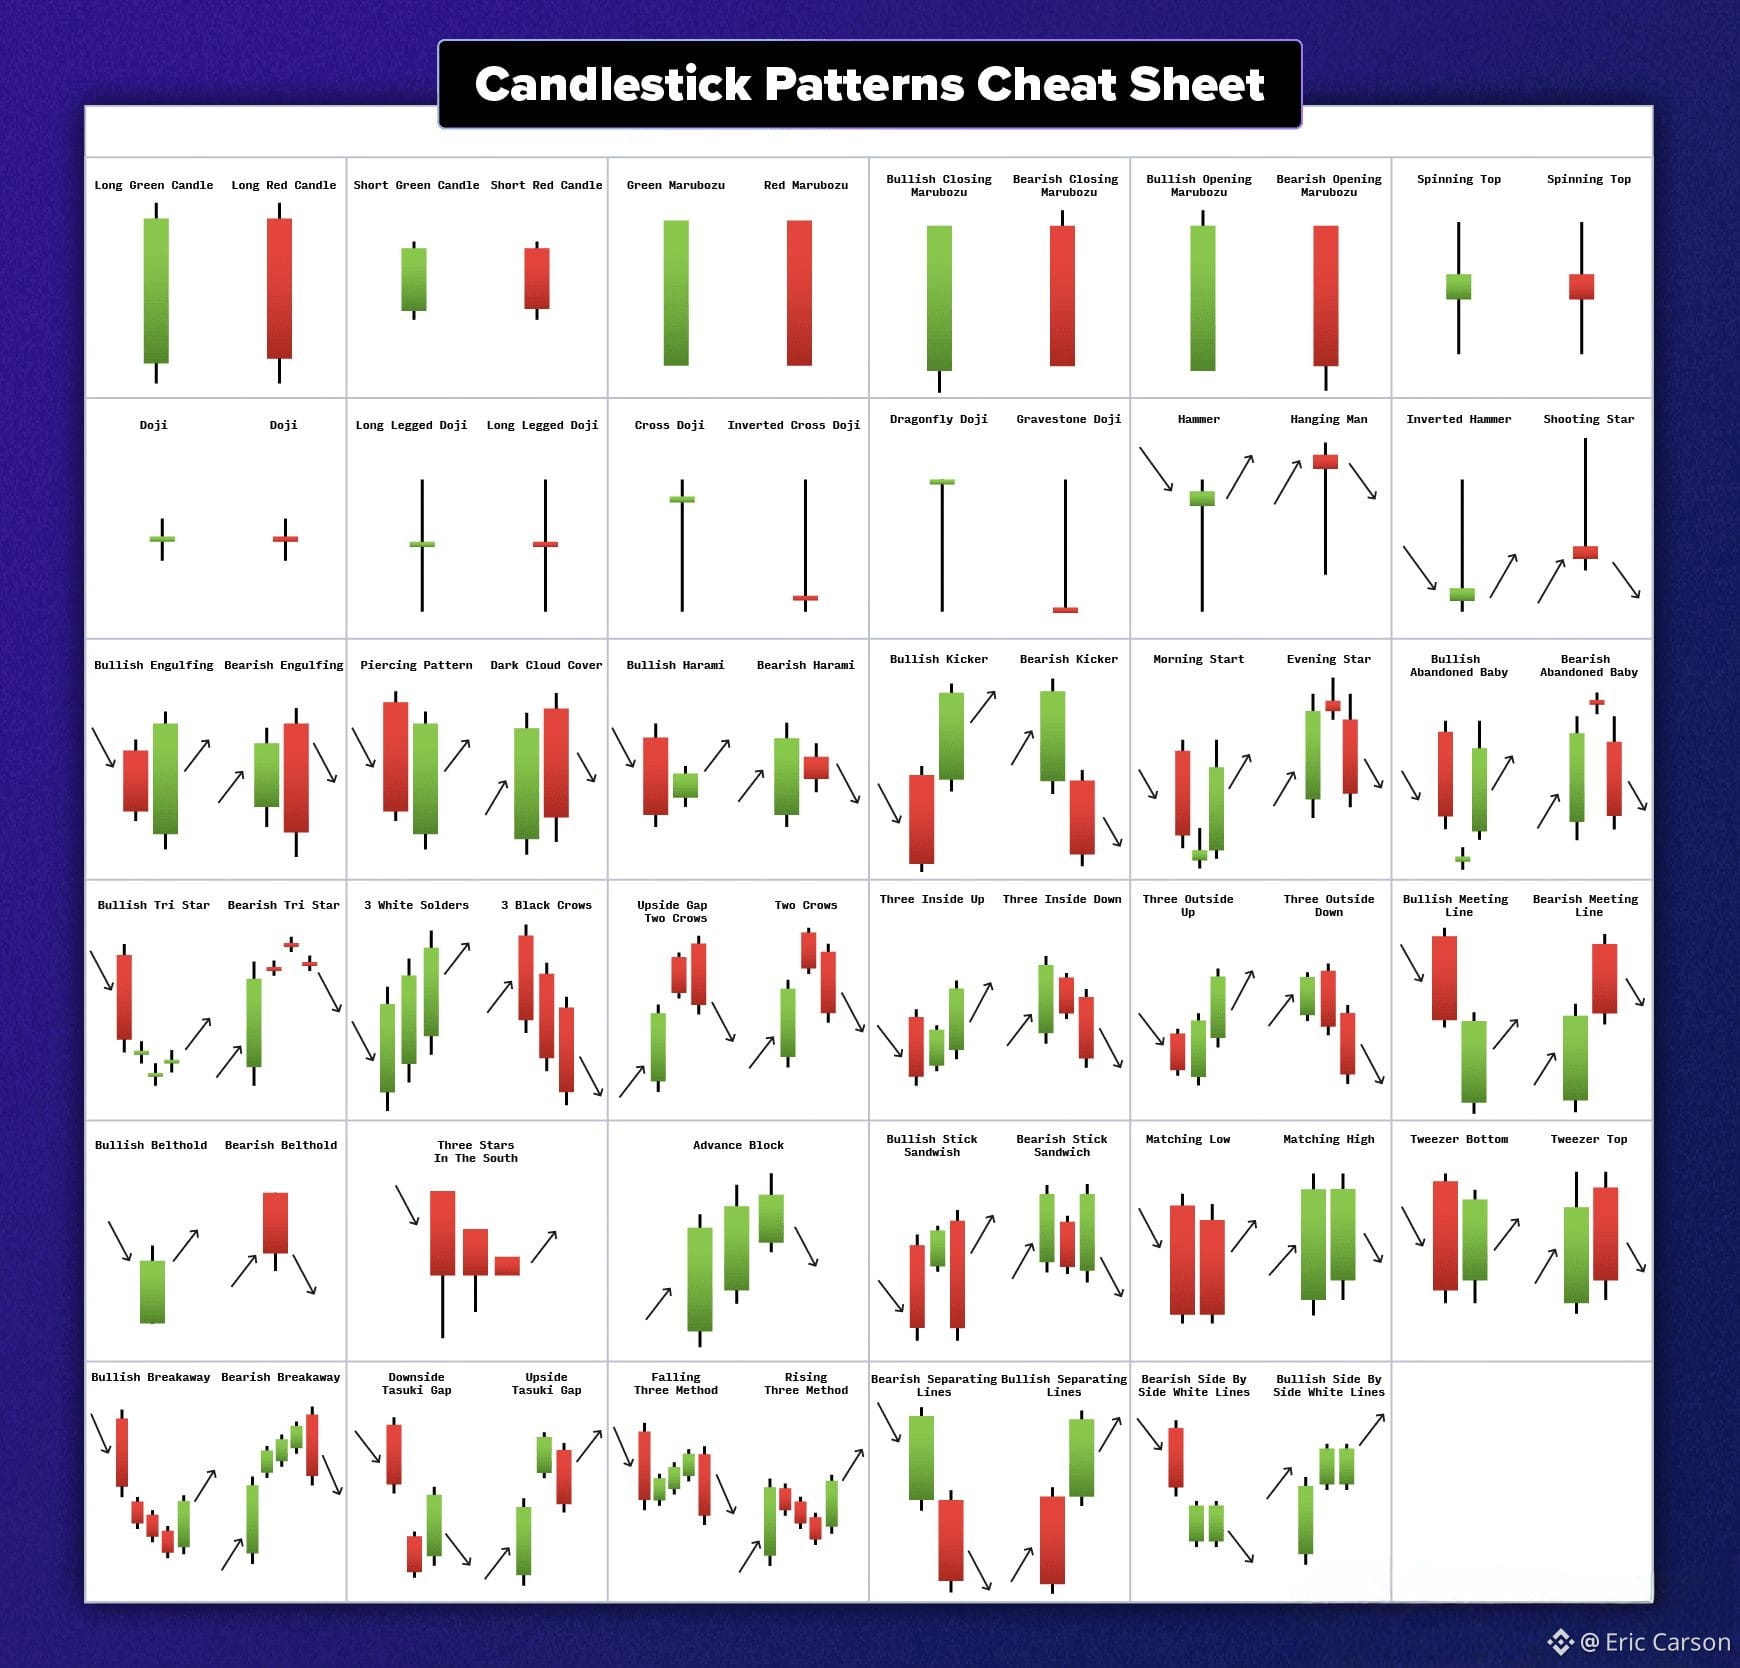
🟢 Green candle → Buyers were stronger
🔴 Red candle → Sellers were stronger
Stack these candles together, and you’re watching the market think in real time.
📊 3 Beginner-Friendly Patterns That Actually Work
1️⃣ Doji — The Pause
➕ Small body, long wicks
➤ Buyers and sellers are undecided
➤ Often appears before a move
Think of it as the market taking a breath.
2️⃣ Engulfing — The Power Shift
🟢 Bullish Engulfing
Small red → Big green
➤ Buyers take control → Price may move up
🔴 Bearish Engulfing
Small green → Big red
➤ Sellers dominate → Price may move down
Momentum changes start here.
3️⃣ Hammer — The Rejection
🔨 Small body + long lower wick
➤ Sellers pushed price down
➤ Buyers stepped in hard
Often seen near short-term bottoms.
🛠️ Simple Trading Flow (Beginner Style)
➤ Choose a liquid stock or crypto pair
➤ Trade during active hours
➤ Wait for a clear pattern (no guessing)
➤ Enter with a small target
➤ Exit fast — don’t overstay
Speed + discipline > prediction.
💰 How $40/day Becomes Real
• One trade = $8–$12
• 4–5 clean setups
• No chasing, no revenge trades
Consistency compounds faster than big wins.
🏆 Why This Approach Fits Beginners
⚡ Clear visual patterns
⚡ Short time commitment
⚡ Focus on execution, not emotions
⚡ Builds real market intuition
📌 Smart Trading Habits
✔ Keep risk small
✔ One setup at a time
✔ Protect capital first
✔ Let results follow discipline
The 5-minute chart isn’t about speed —
It’s about learning how price reacts under pressure.
Master that, and confidence follows.