When you look at a crypto chart, you’ll often see colored lines weaving through the candles. These are moving averages, and one of the most popular is the EMA — Exponential Moving Average. But what is it, and why should you care? Let’s break it down.
♡ What is an EMA?
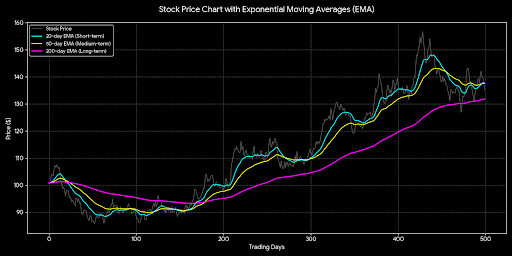
An Exponential Moving Average (EMA) is a line that shows the average price of an asset over a specific period, but with a twist: it gives more weight to recent prices. This makes it much faster to react to price changes compared to a simple moving average (SMA), which treats all prices equally.
□ For example:
A ] EMA(7) looks at the last 7 periods (days, hours, or minutes) and reacts quickly to price swings.
B ] EMA(25) is slower, giving a smoother trend.
C ] EMA(99) is even slower, showing the long-term trend.
Think of EMA like a speedometer for price trends — the shorter the EMA, the more sensitive it is.
♡ Why Traders Use EMAs
1. Trend Detection – If price is above the EMA, the trend is usually bullish; if below, it’s bearish.
2. Support & Resistance – EMAs often act like invisible lines where price bounces or finds resistance.
3. Crossovers – When a short-term EMA crosses above a long-term EMA, it’s a bullish signal (“golden cross”). When it crosses below, it’s bearish (“death cross”).
□ Example in Crypto
Imagine MYX is trading at $5.97
EMA(7) = $5.76 → price above it → short-term bullish
EMA(25) = $5.50 → price above it → trend gaining strength
EMA(99) = $4.41 → price well above it → long-term trend is bullish
♡ Quick Tip
The short-term EMA reacts fast but can give false signals in choppy markets. The long-term EMA is more reliable for spotting overall trends. Combining multiple EMAs gives a clearer picture of both momentum and trend direction.
✅ Bottom Line:
EMAs are powerful because they balance speed and reliability. They help you see trends early, spot potential reversals, and identify key support/resistance zones. Every serious trader keeps an eye on EMA lines before making a move.