Let’s stop pretending
Bitcoin is not confused
Bitcoin is at a decision level that always produces violence — up or down
And the chart has been warning anyone who knows how to read it
📉 What $BTC Is Telling You (1D–1W Structure)

Right now BTC is sitting on a major structural shelf that has held multiple times
📍 Key BTC Levels You MUST Know
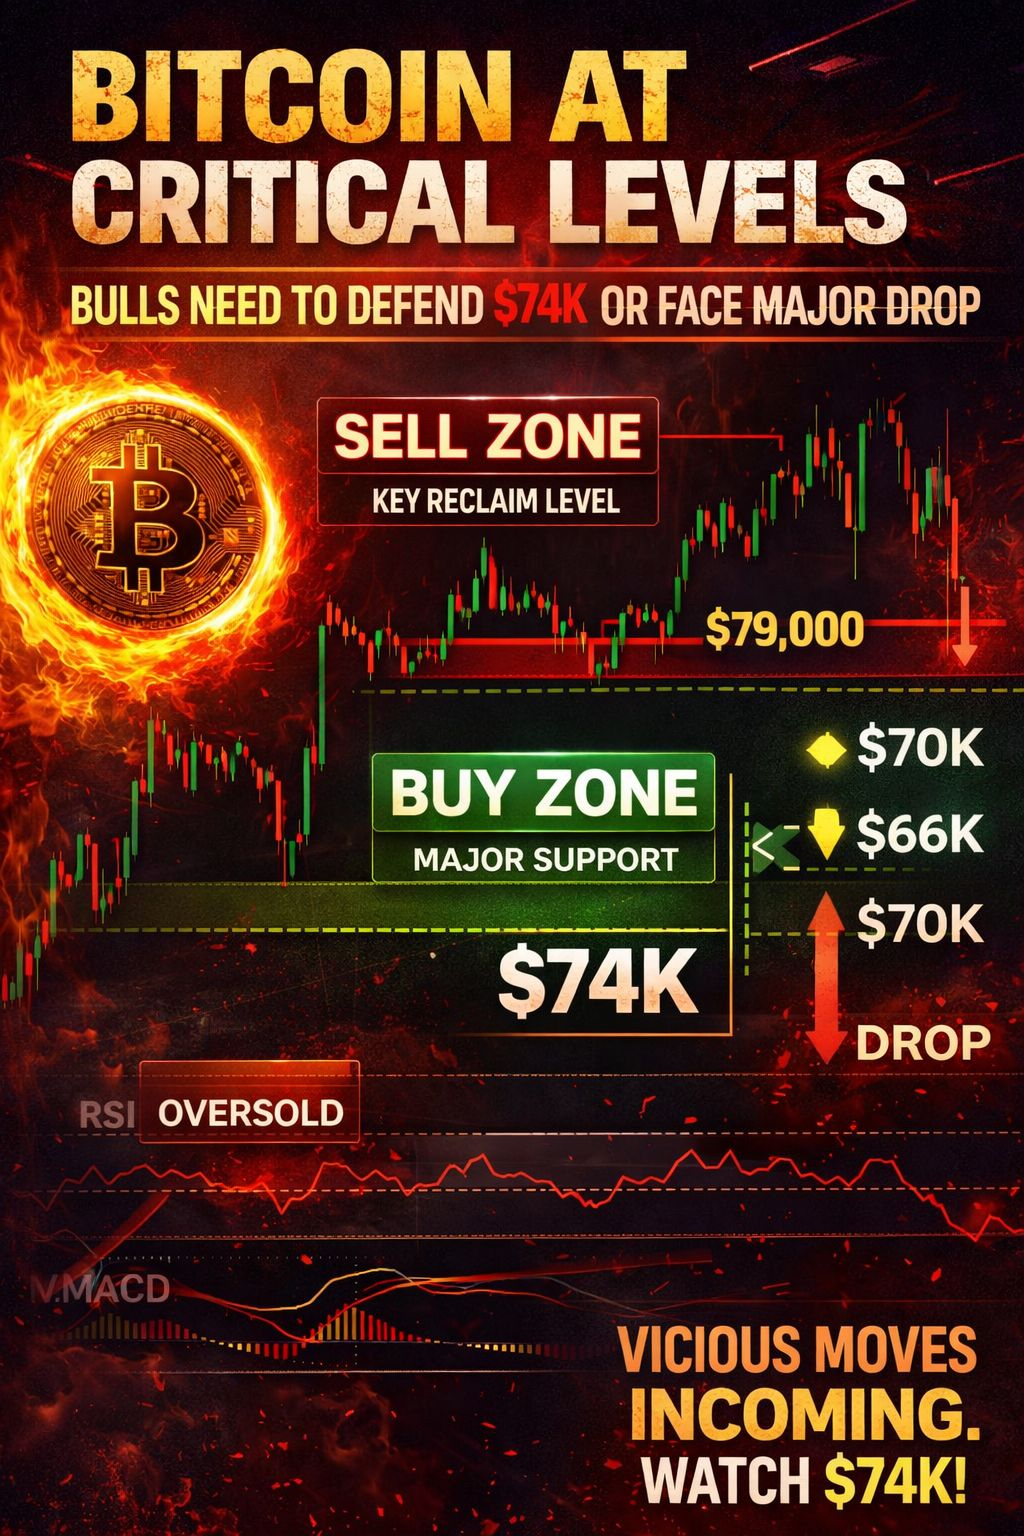
🟢 Major Support: $74,200 – $74,500
This is the level bulls cannot afford to lose
🔴 Breakdown Target (if support fails)
➡️ $70,000 – $71,000
➡️ Below that: $66,000 liquidity zone
🟡 Key Reclaim Level: $79,500 (daily close)
This is where momentum shifts from defensive to offensive
🚀 Expansion Zone (if reclaimed):
➡️ $82,000 – $85,000

There is no neutral zone here
⚠️ Momentum Is Stretched — But That’s Not Bullish Yet
Let’s be precise
• RSI is oversold
• MACD is deeply negative
• Selling pressure is extended
That does not mean buy now
It means
👉 A reaction is coming
👉 Direction depends entirely on structure
Oversold markets bounce
unless support breaks
🧠 The Trap Most Traders Are Walking Into
Retail is
Front-running a bounce
Over-leveraging near support
Ignoring the daily close
Smart money is:
Waiting for confirmation
Letting price show its hand
Protecting capital first
This is where impatience gets punished
🔑 Two Scenarios. No Third Option.
🟢 Scenario 1: Bulls Defend Structure
• BTC holds $74K
• Reclaims $79.5K
• Shorts get squeezed
• Relief rally ignites toward $82K–$85K
🔴 Scenario 2: Structure Fails
• $74K breaks
• Stops cascade
• Liquidity hunt toward $70K
• Panic accelerates
Slow moves do not happen from zones like this

📌 Final Reality Check
This is not the time to be emotional
This is the time to be precise
The chart has already done its job.
Now it’s waiting to see who respects it
👉 Does $74K hold — or does Bitcoin take the liquidity below?
Pick a side
But let the chart confirm it
#BTC #TechnicalAnalysis #Marketstructure #BinanceSquare #trending