In the wild world of crypto trading, where prices can swing like a pendulum on steroids, understanding candlestick charts is like having a secret decoder ring. These little bars aren't just pretty visuals—they pack a punch of information about market sentiment, potential reversals, and continuations. As a seasoned trader who's ridden the waves of Bitcoin booms and altcoin dumps, I'll break down the main candlestick patterns to arm you with the knowledge to spot opportunities and avoid pitfalls. Let's dive in.
The Basics: What Makes Up a Candlestick?
Every candlestick on a crypto chart represents a specific time period—could be 1 minute, 1 hour, or daily—showing the open, high, low, and close prices. The "body" is the thick part between open and close: green (or white) if the close is higher than the open (bullish), red (or black) if lower (bearish). The thin lines, called wicks or shadows, show the high and low extremes.
Think of it as a battle between buyers and sellers. A long upper wick means sellers pushed prices down from the high, while a long lower wick shows buyers fought back from the lows. Volume often adds context—higher volume on a candle strengthens its signal.
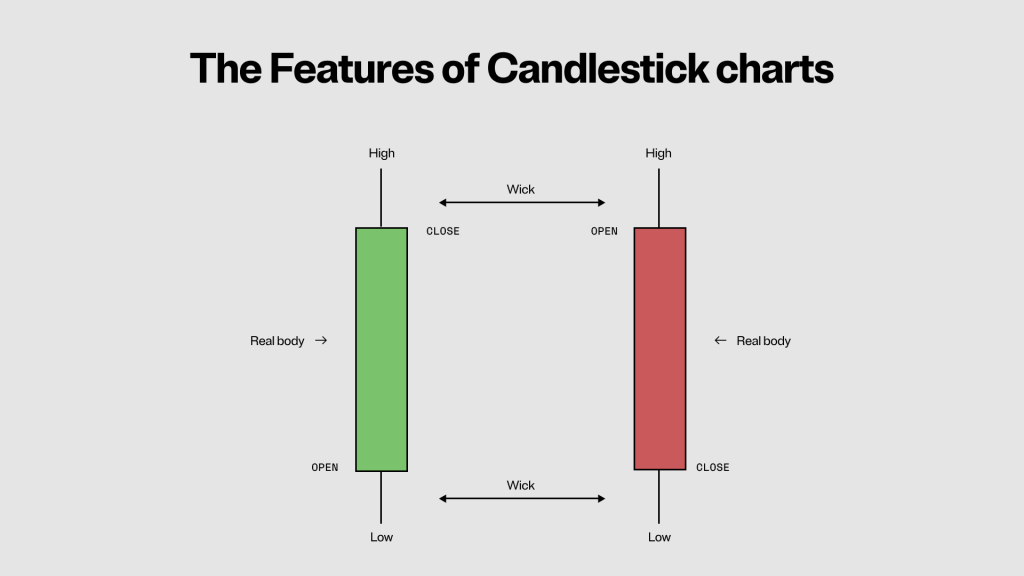
Master this anatomy, and you're ready to read the market's story.
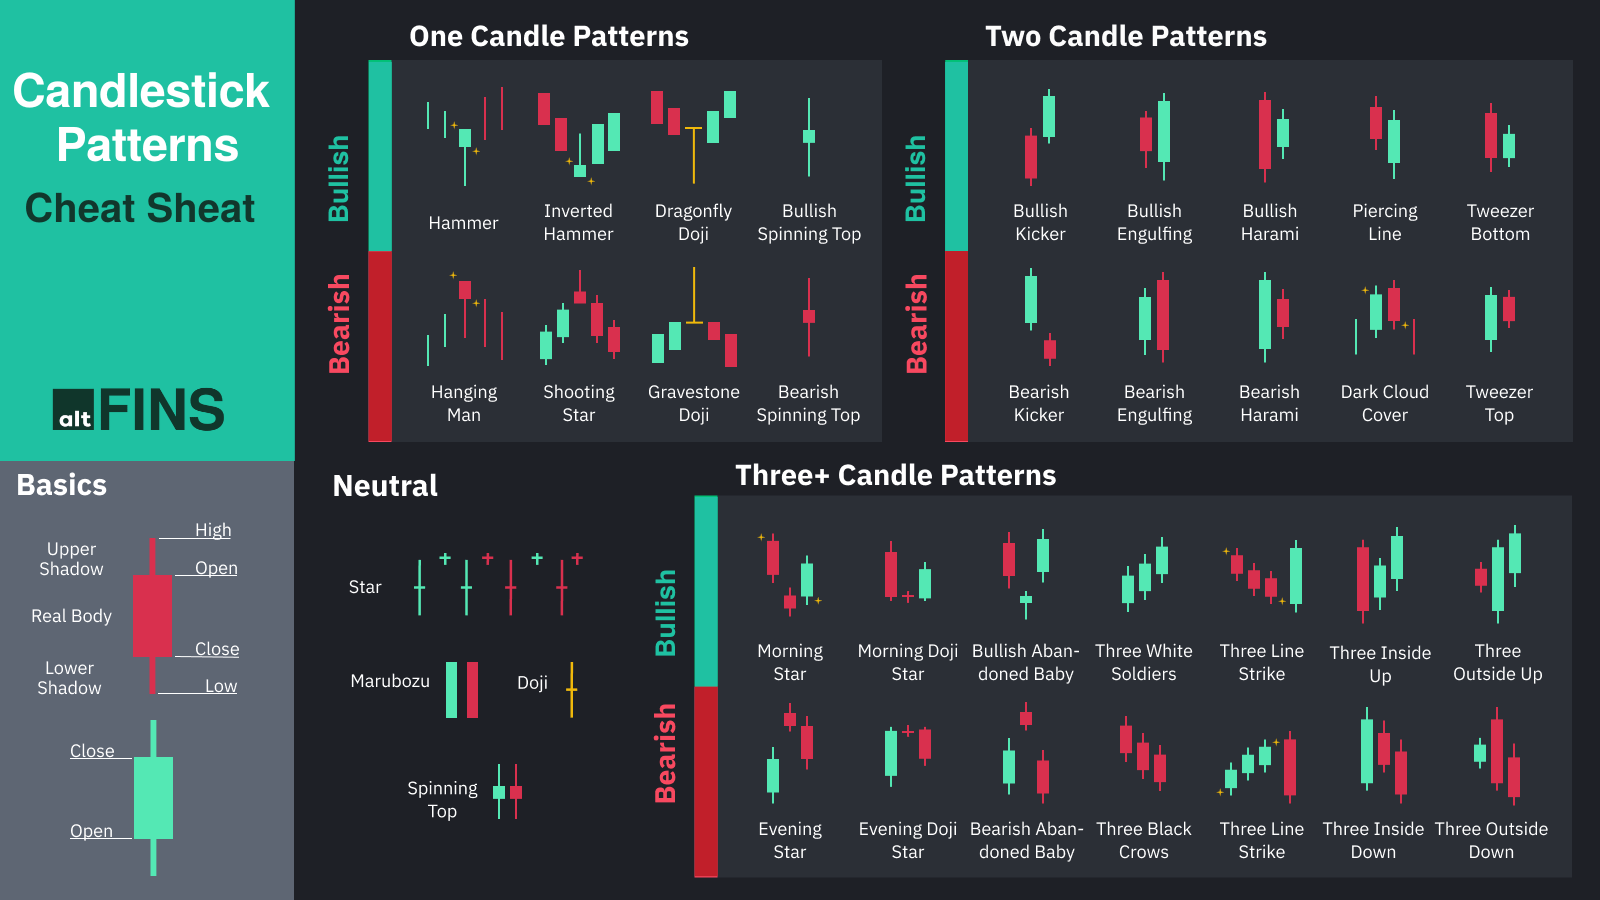
Single Candle Powerhouses: Quick Signals
Single candlesticks can scream reversal or indecision. Here are the heavy hitters:
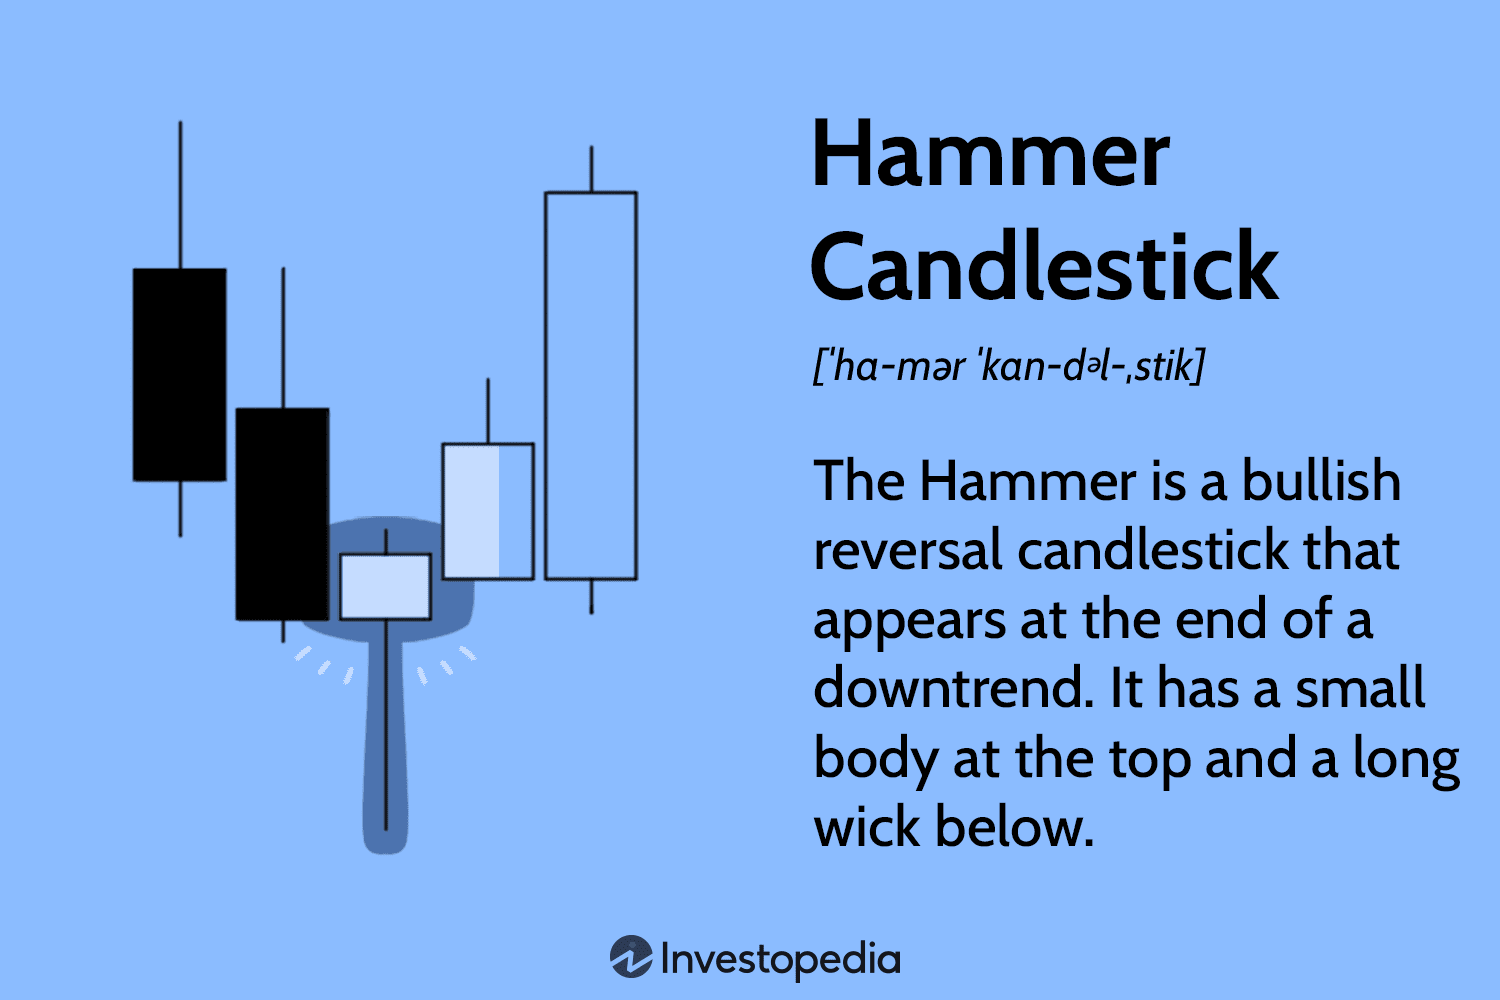
Hammer: This bullish reversal shows up at the bottom of a downtrend. Small body at the top, long lower wick (at least twice the body), tiny or no upper wick. It says sellers drove prices low, but buyers hammered back control. Spot this after a sell-off, and it might signal a bounce—confirm with the next candle closing higher.
• Shooting Star: The bearish twin of the hammer. Appears at the top of an uptrend with a small body at the bottom, long upper wick. Buyers pushed high, but sellers shot it down. A red body amps up the bearish vibe—watch for downside follow-through.
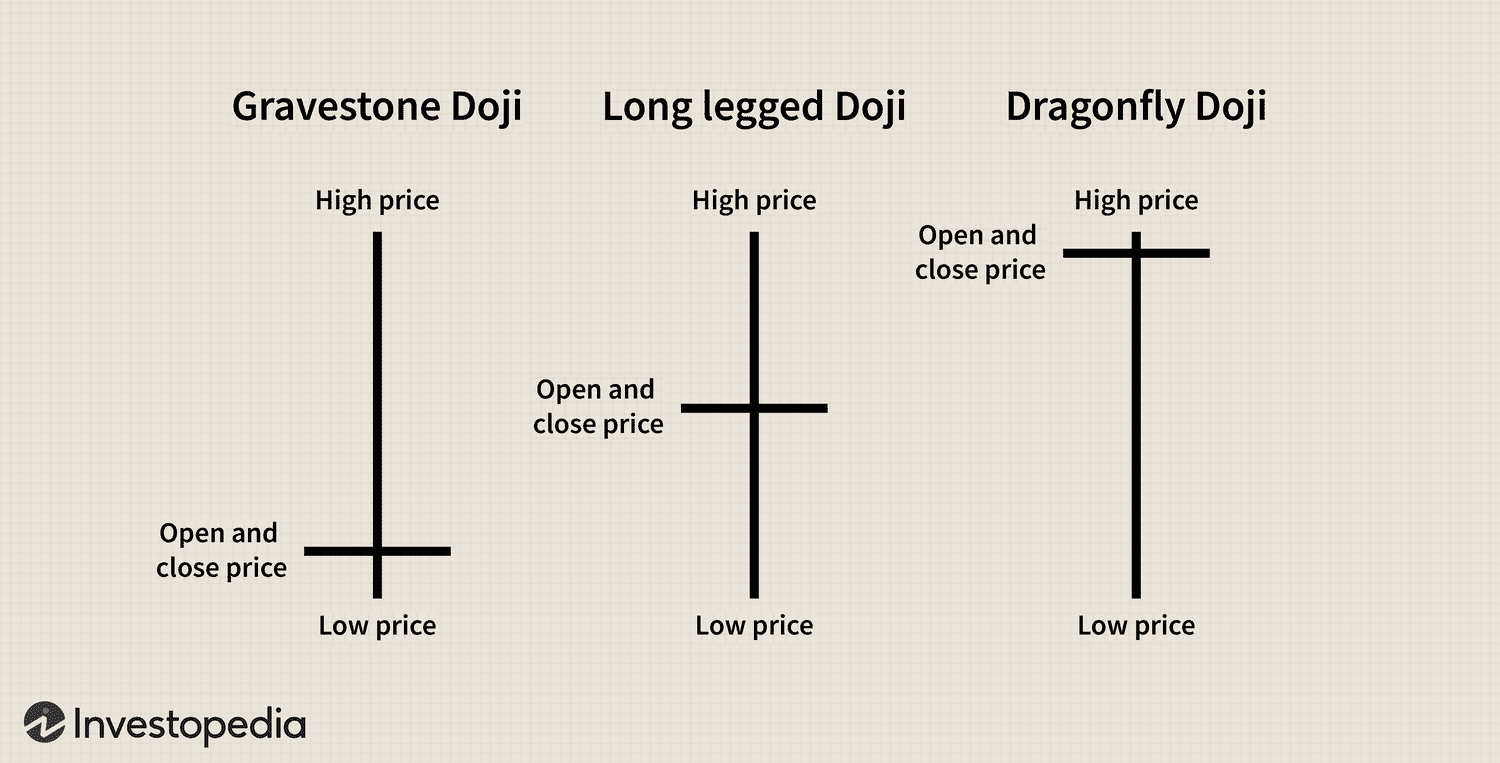
• Doji: Pure indecision. Open and close are virtually the same, creating a cross-like shape. Variants like dragonfly (long lower wick) lean bullish, gravestone (long upper wick) bearish. In a trend, it hints at exhaustion; in ranging markets, it's noise. Always check context.
These singles are great for short-term trades, especially on lower timeframes in volatile coins like Solana or Ethereum.
Multi-Candle Patterns: The Real Game-Changers
Patterns involving two or three candles give stronger signals because they show momentum shifts over time.
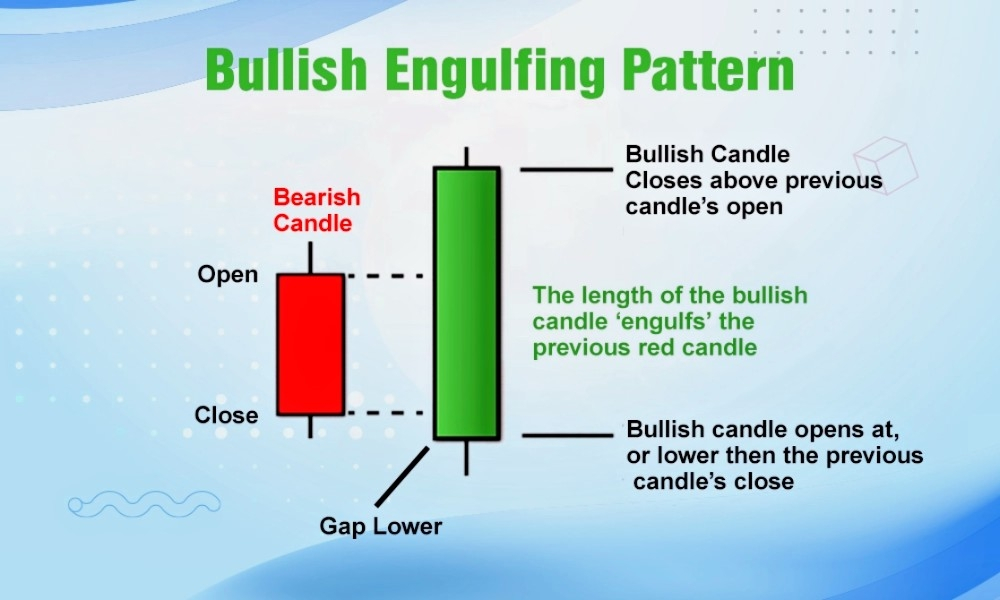
Bullish Engulfing: A two-candle reversal in a downtrend. First, a red candle; then a green one that completely "engulfs" the previous body's range (opens lower, closes higher). It's buyers overwhelming sellers—potent at support levels. I've caught many bottoms with this, but wait for volume spike.
Bearish Engulfing: Flip it—uptrend ends with a green candle followed by a red one engulfing it. Sellers take charge. Killer for spotting tops, especially near resistance.
Morning Star: Three-candle bullish reversal. Downtrend: red candle, then a small body (doji or spinning top) gapping down, followed by a strong green candle closing well into the first's body. Like dawn after darkness—signals hope for bulls.
Evening Star: Bearish version. Uptrend: green candle, small body gapping up, then red candle plunging into the first's body. Evening falls, prices might too.
These patterns shine in crypto because of 24/7 trading—combine with RSI or moving averages for confirmation.
Putting It to Work: Current Crypto Examples
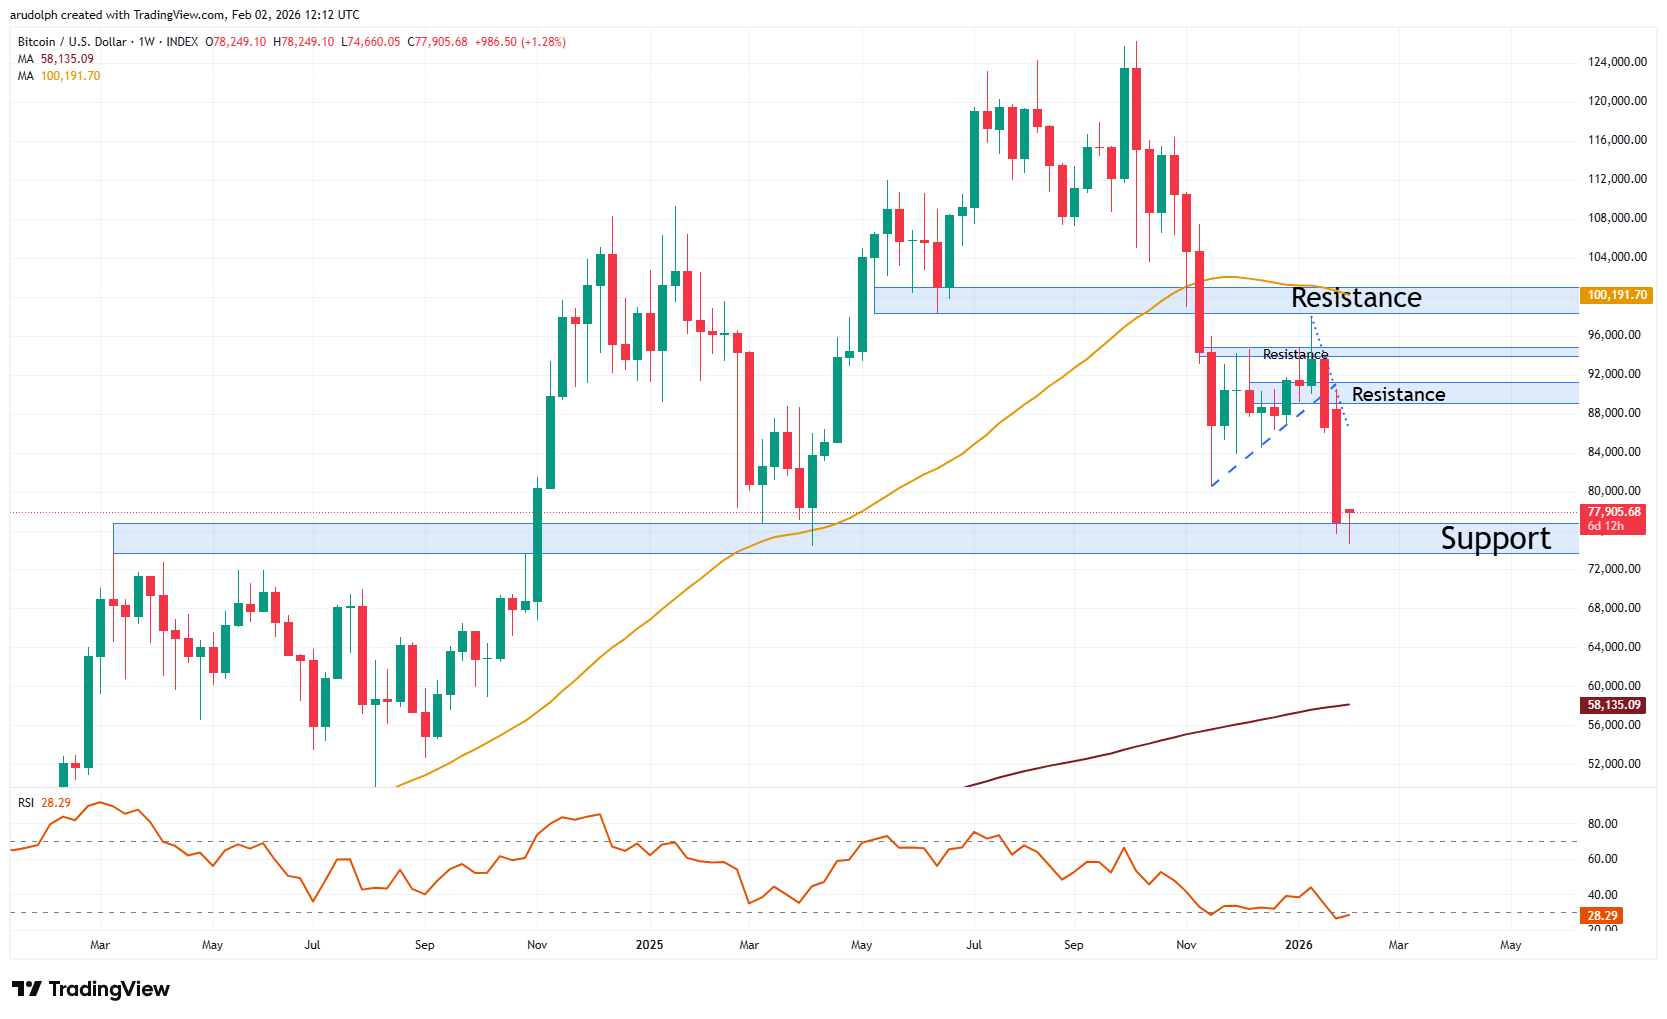
Let's apply this to real charts. As of early February 2026, Bitcoin's daily chart shows volatility after a sharp sell-off, rebounding from key support around $70,000. Notice the hammer-like candles near the lows, hinting at buyer defense. If we see a bullish engulfing here, it could propel BTC toward $100,000 resistance.
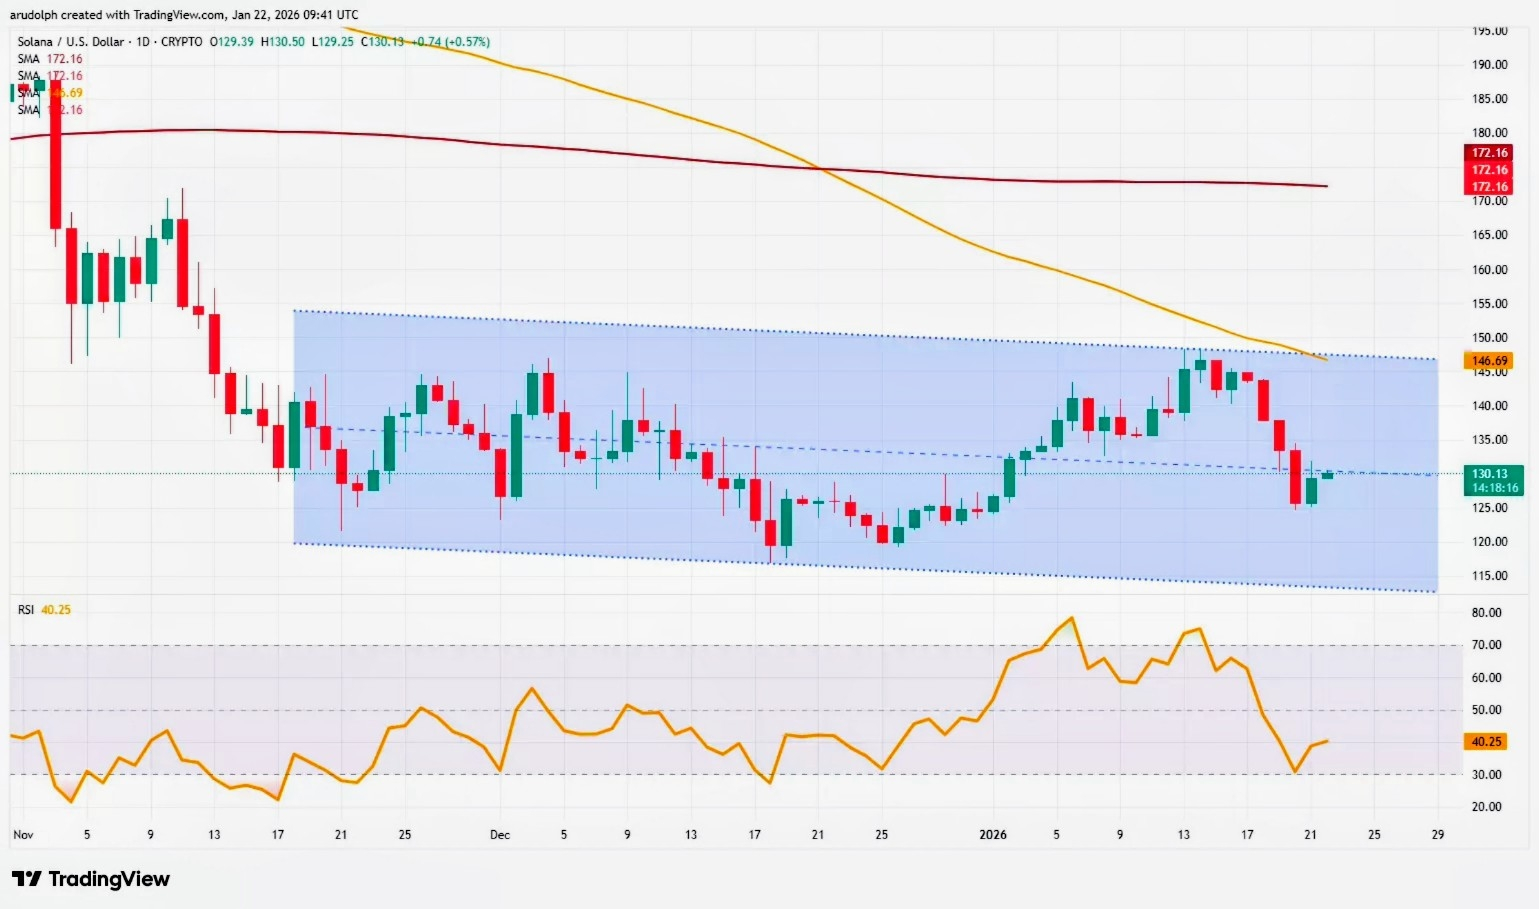
Over on Solana, the chart steadied near $130 support amid caution. Look for doji clusters indicating indecision— a morning star formation could spark a rally, but bearish engulfing might push it lower. Crypto's fast-paced, so zoom into 4-hour charts for entries.
Pro Tips for Candlestick Mastery
Context is King: A hammer in a strong uptrend? Probably continuation, not reversal. Always zoom out.
Volume Matters: Low-volume patterns are weak; high-volume ones pack conviction.
Combine Tools: Pair candlesticks with support/resistance, Fibonacci, or MACD. In crypto, news like ETF approvals can override tech signals.
Timeframes Align: Check higher timeframes for trend, lower for timing.
Risk Management: Never bet the farm on one pattern. Use stops below lows for longs, above highs for shorts.
Candlesticks aren't crystal balls, but they're the closest thing in trading. Practice on demo accounts, backtest patterns on historical crypto data, and you'll start seeing the market's whispers turn into roars. Stay sharp, trade smart.