Crypto charts are like roadmaps in a chaotic market—full of twists, turns, and hidden treasures. While candlesticks give you the micro view, chart patterns zoom out to reveal the bigger picture, showing potential reversals or continuations in trends. These formations emerge from price action connecting highs and lows with trendlines, often signaling where the market might head next. In crypto's 24/7 frenzy, spotting them early can mean the difference between riding a wave or getting wiped out. Let's break down the essentials, with real examples from current charts to keep it practical.
Chart Patterns 101: The Foundation
Chart patterns form when prices consolidate or reverse, creating recognizable shapes on the graph. They're classified into reversal patterns (end of trend) and continuation patterns (pause in trend). Key elements include trendlines (connecting highs/lows), support/resistance levels, and breakout points where volume spikes confirm the move. Measure targets by projecting the pattern's height from the breakout—simple math like adding the base to the neckline for upside potential. Always confirm with indicators like RSI to avoid fakeouts, especially in volatile assets like Bitcoin or Solana.
Reversal Patterns: Flipping the Script
These signal a trend change, perfect for catching tops or bottoms.
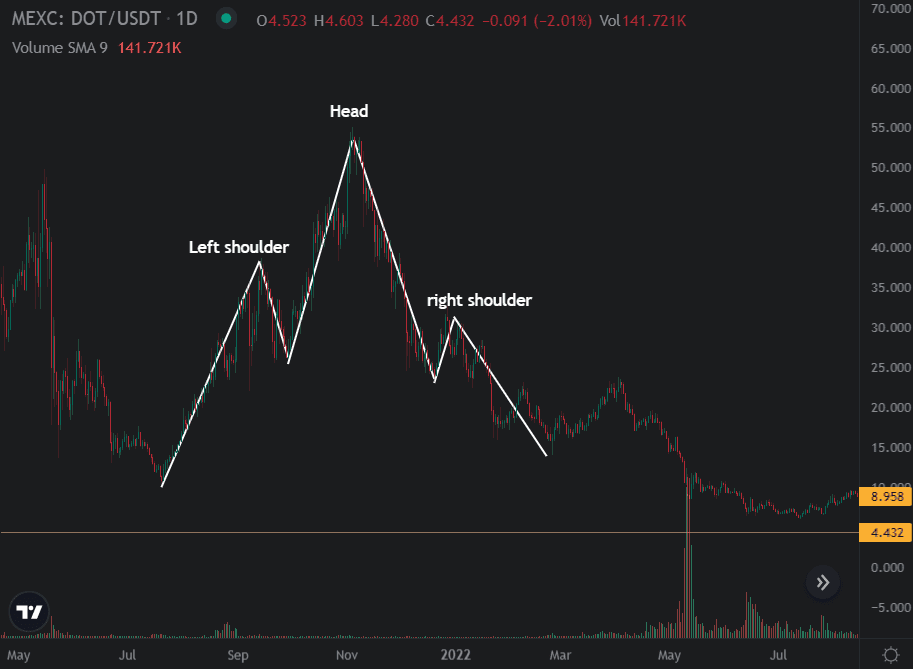
Head and Shoulders: A classic bearish reversal after an uptrend. It features a left shoulder (peak), higher head (peak), right shoulder (lower peak), connected by a neckline (support). Break below the neckline? Expect a drop equal to the head's height. Volume decreases on the right shoulder, surges on breakout.
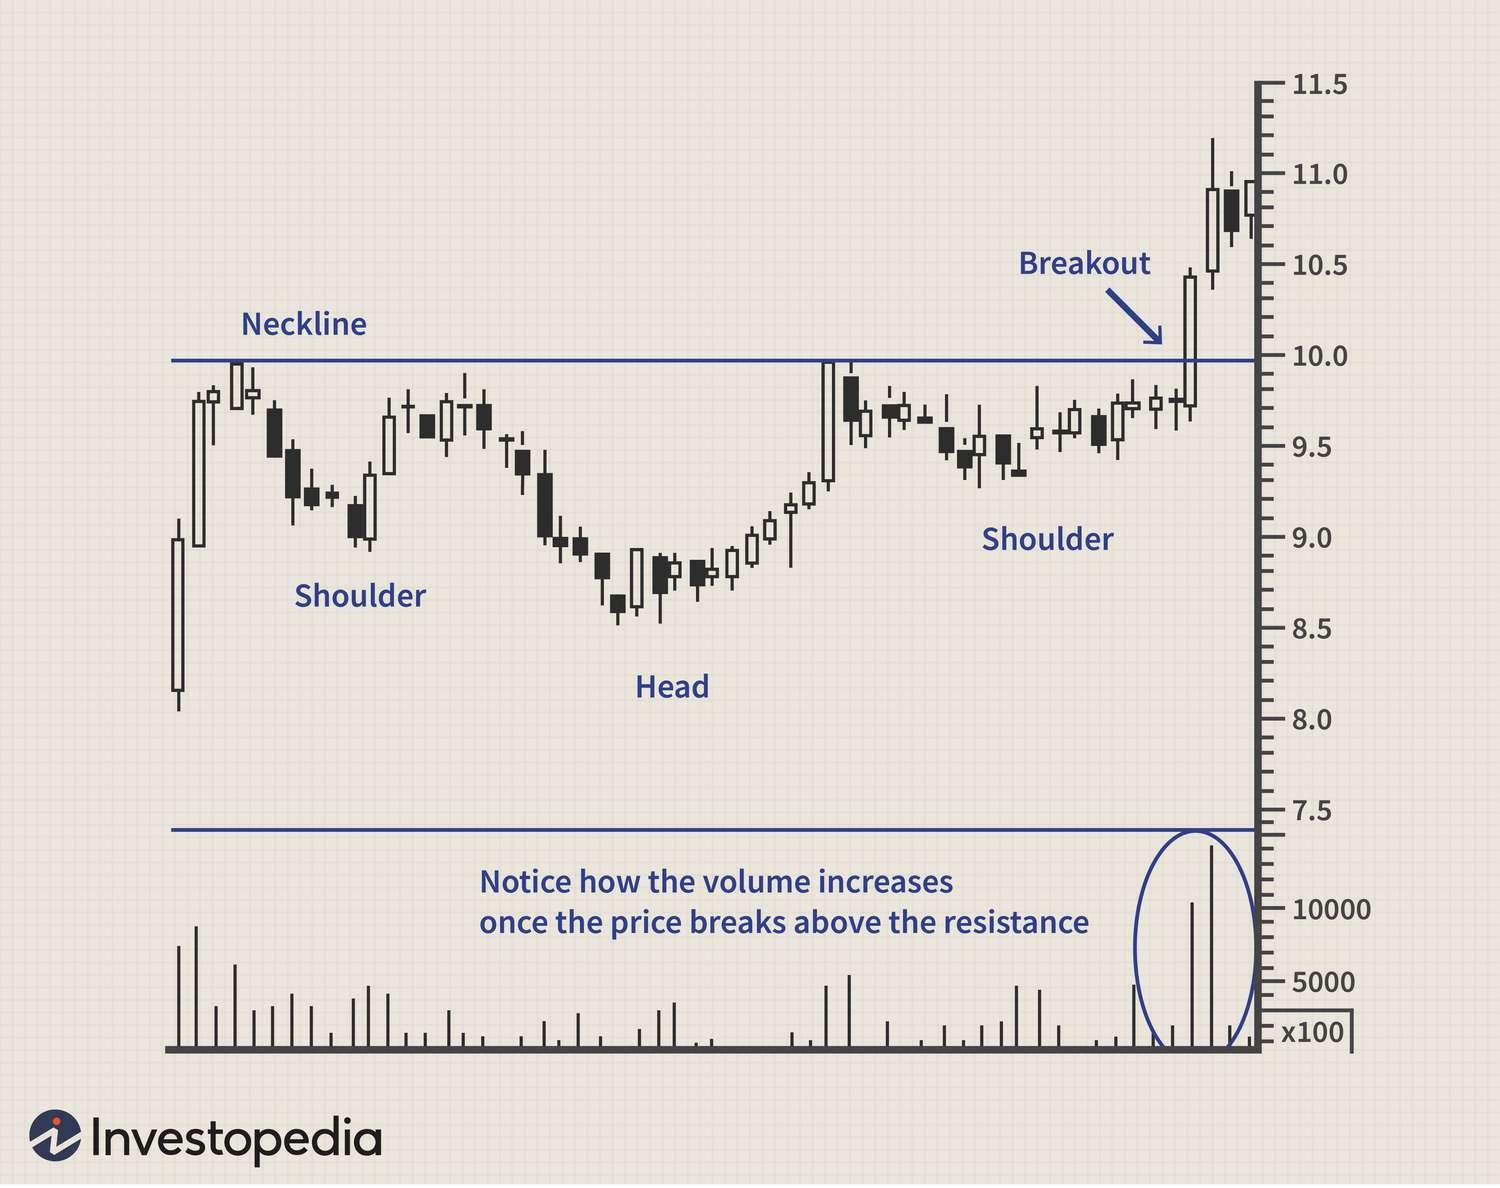
• Inverse Head and Shoulders: The bullish flip for downtrends. Lower head between two shoulders, neckline as resistance. Break above signals upside, target by adding head depth to breakout point. Great for spotting crypto recoveries.
• Double Top/Bottom: Shaped like an "M" (top) or "W" (bottom). Double top: two peaks at resistance, break below support confirms bearish reversal. Double bottom: two lows at support, break above resistance turns bullish. Measure move: height from peaks/lows projected from breakout.
These are reliable in crypto, but watch for failures in sideways markets.
Continuation Patterns: Riding the Momentum
These suggest the trend will resume after a breather.
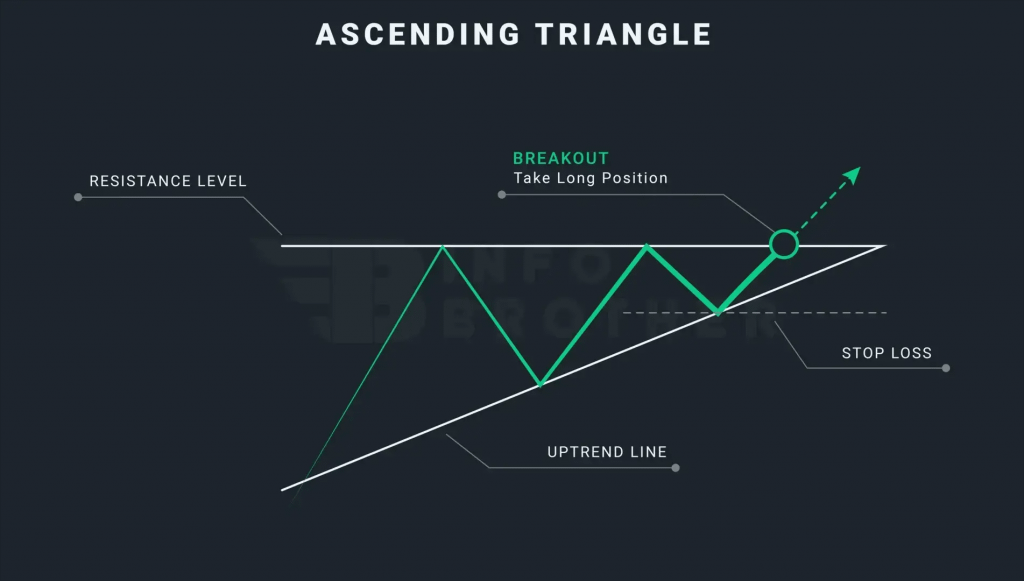
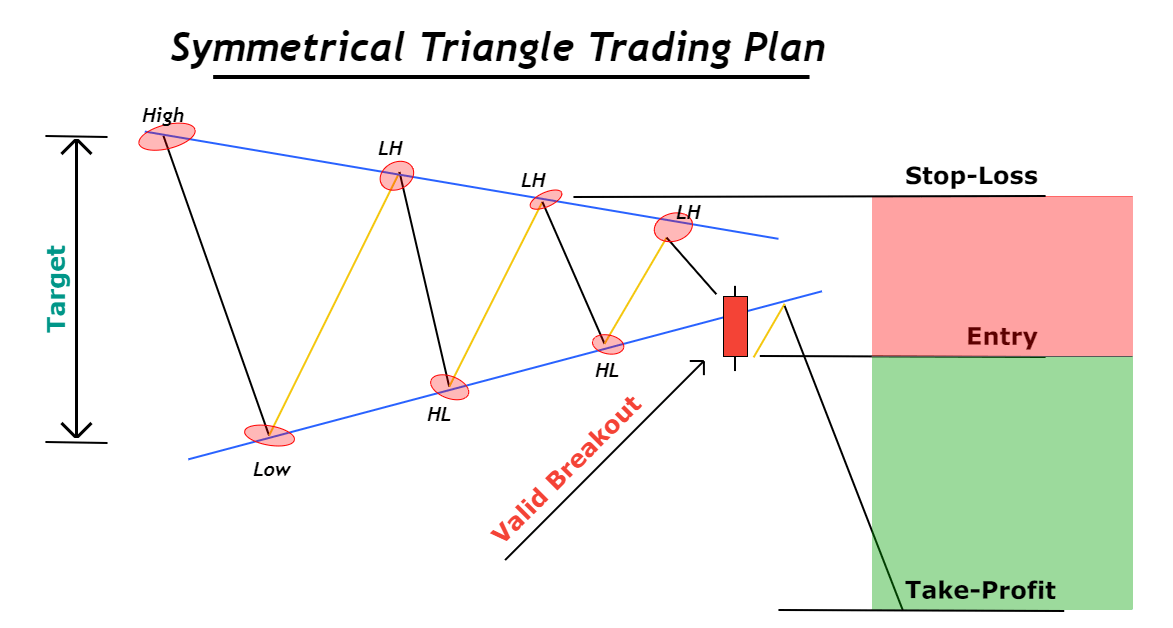
Triangles: Consolidation zones narrowing to a point. Ascending (flat top, rising bottom) is bullish in uptrends—breakout up on volume. Descending (falling top, flat bottom) bearish. Symmetrical (converging lines) neutral, direction depends on breakout.
For symmetrical, target is the triangle's base width from apex.
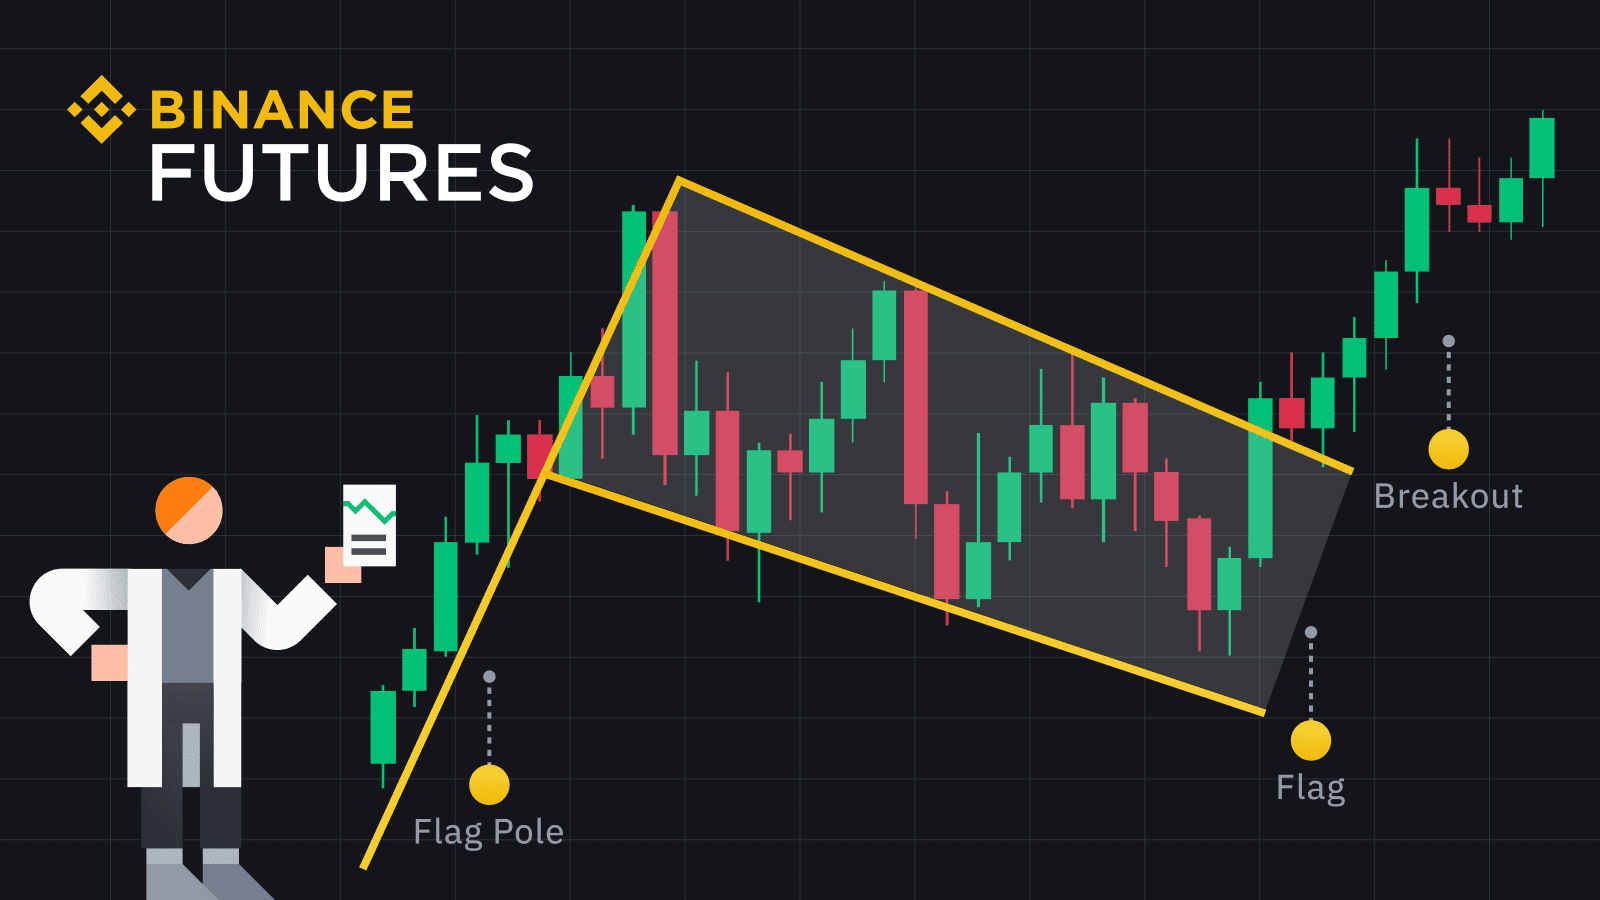
• Flags and Pennants: Short-term pauses after sharp moves. Bull flag: rectangular consolidation down after upsurge, breakout continues up. Pennant: triangle after pole. Measure by projecting pole length from breakout.
• Cup and Handle: Bullish, like a teacup. Rounded bottom (cup), small pullback (handle). Break above handle resistance launches the rally, target cup depth added to breakout.
Real-World Crypto Examples in 2026
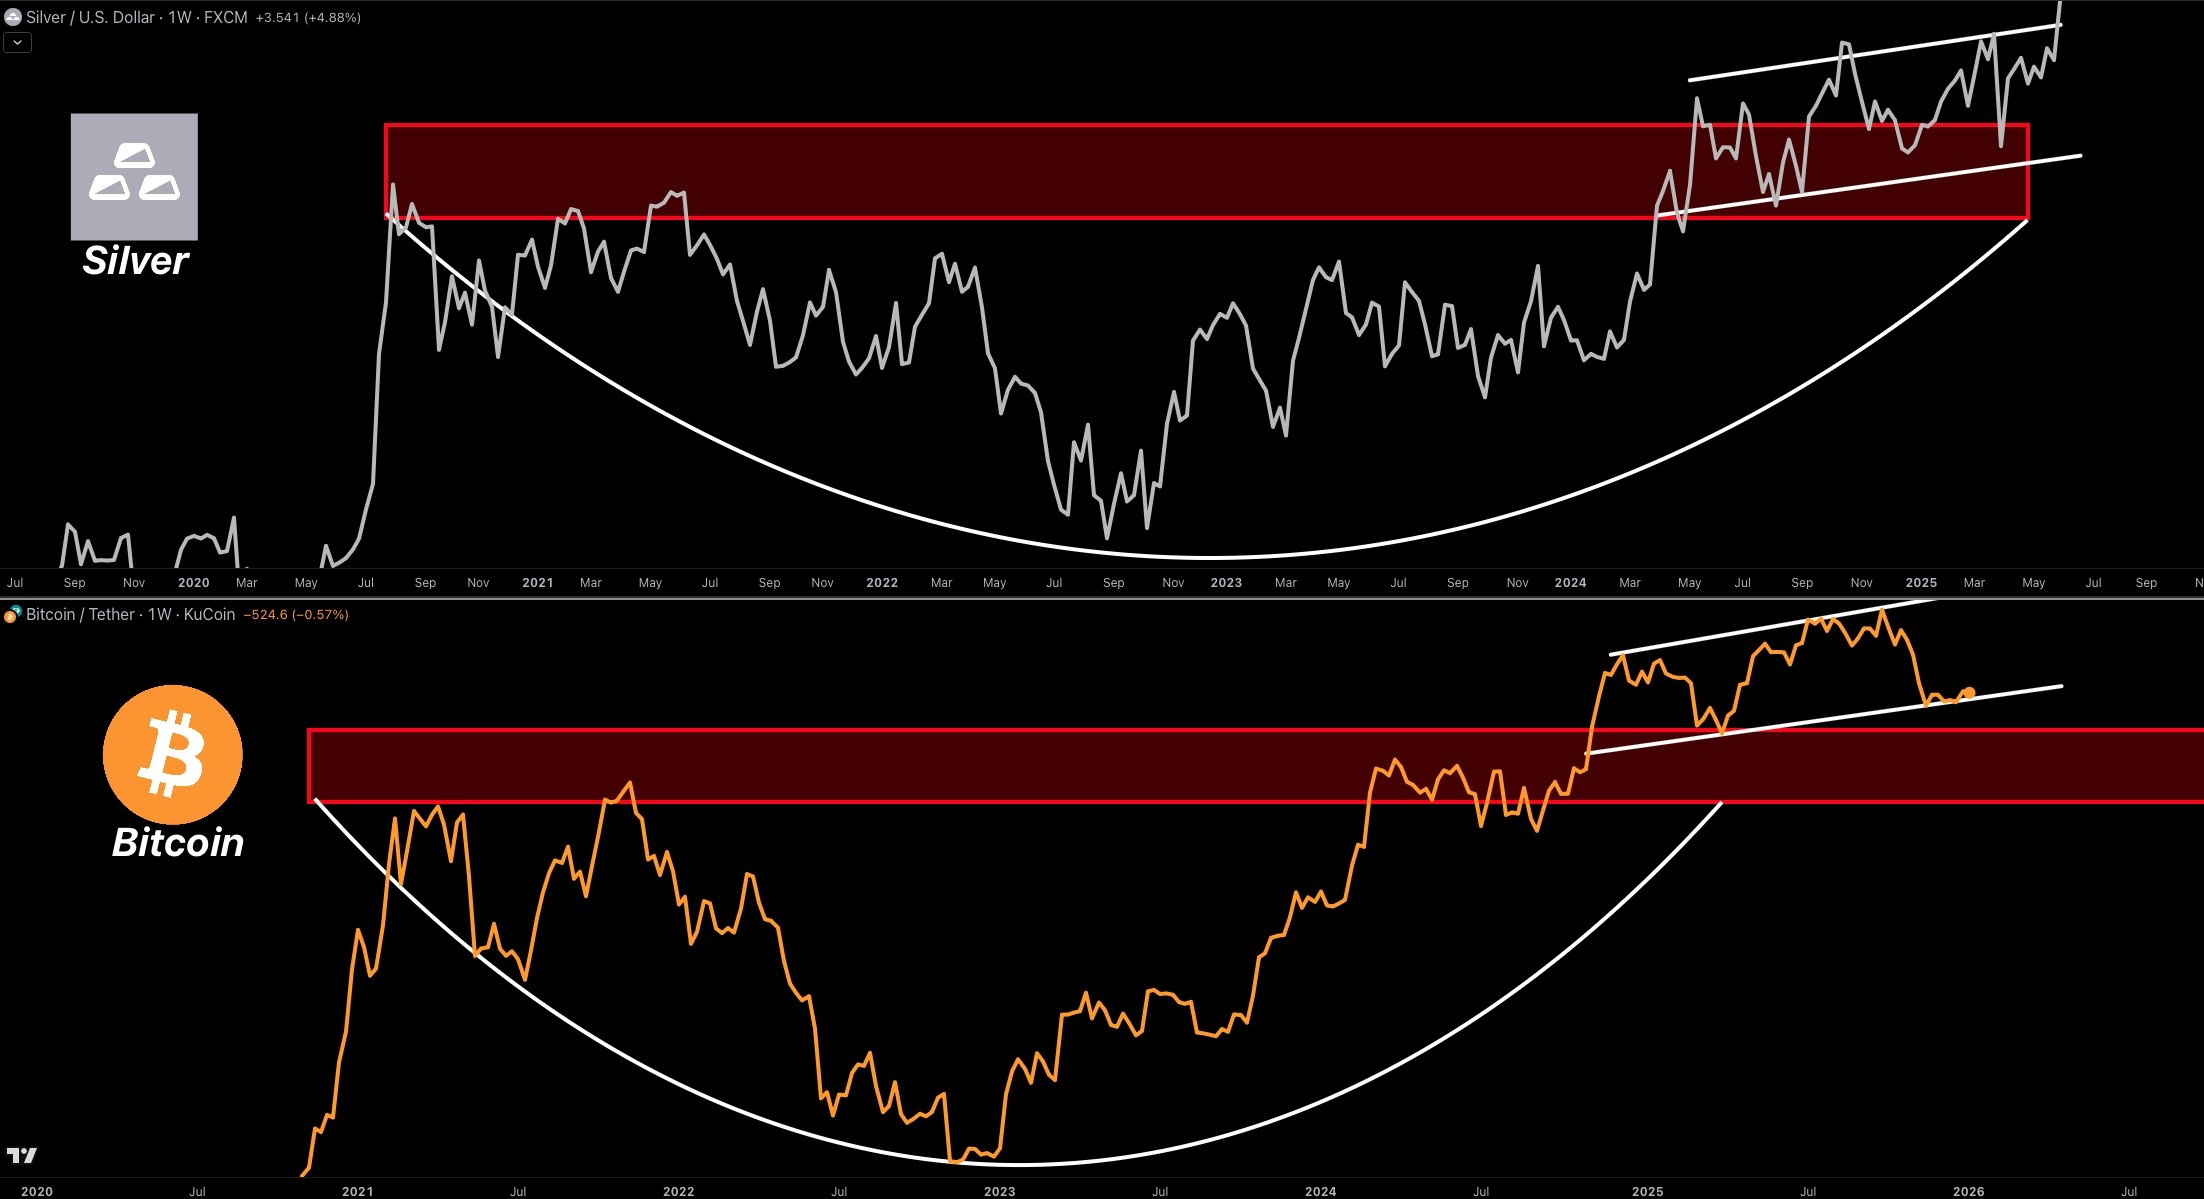
Applying this to today's market: Bitcoin's weekly chart as of early February 2026 shows a potential cup and handle forming over the past years, with the handle testing resistance around $100K. A breakout could push toward $150K, but watch volume—low conviction might invalidate it.
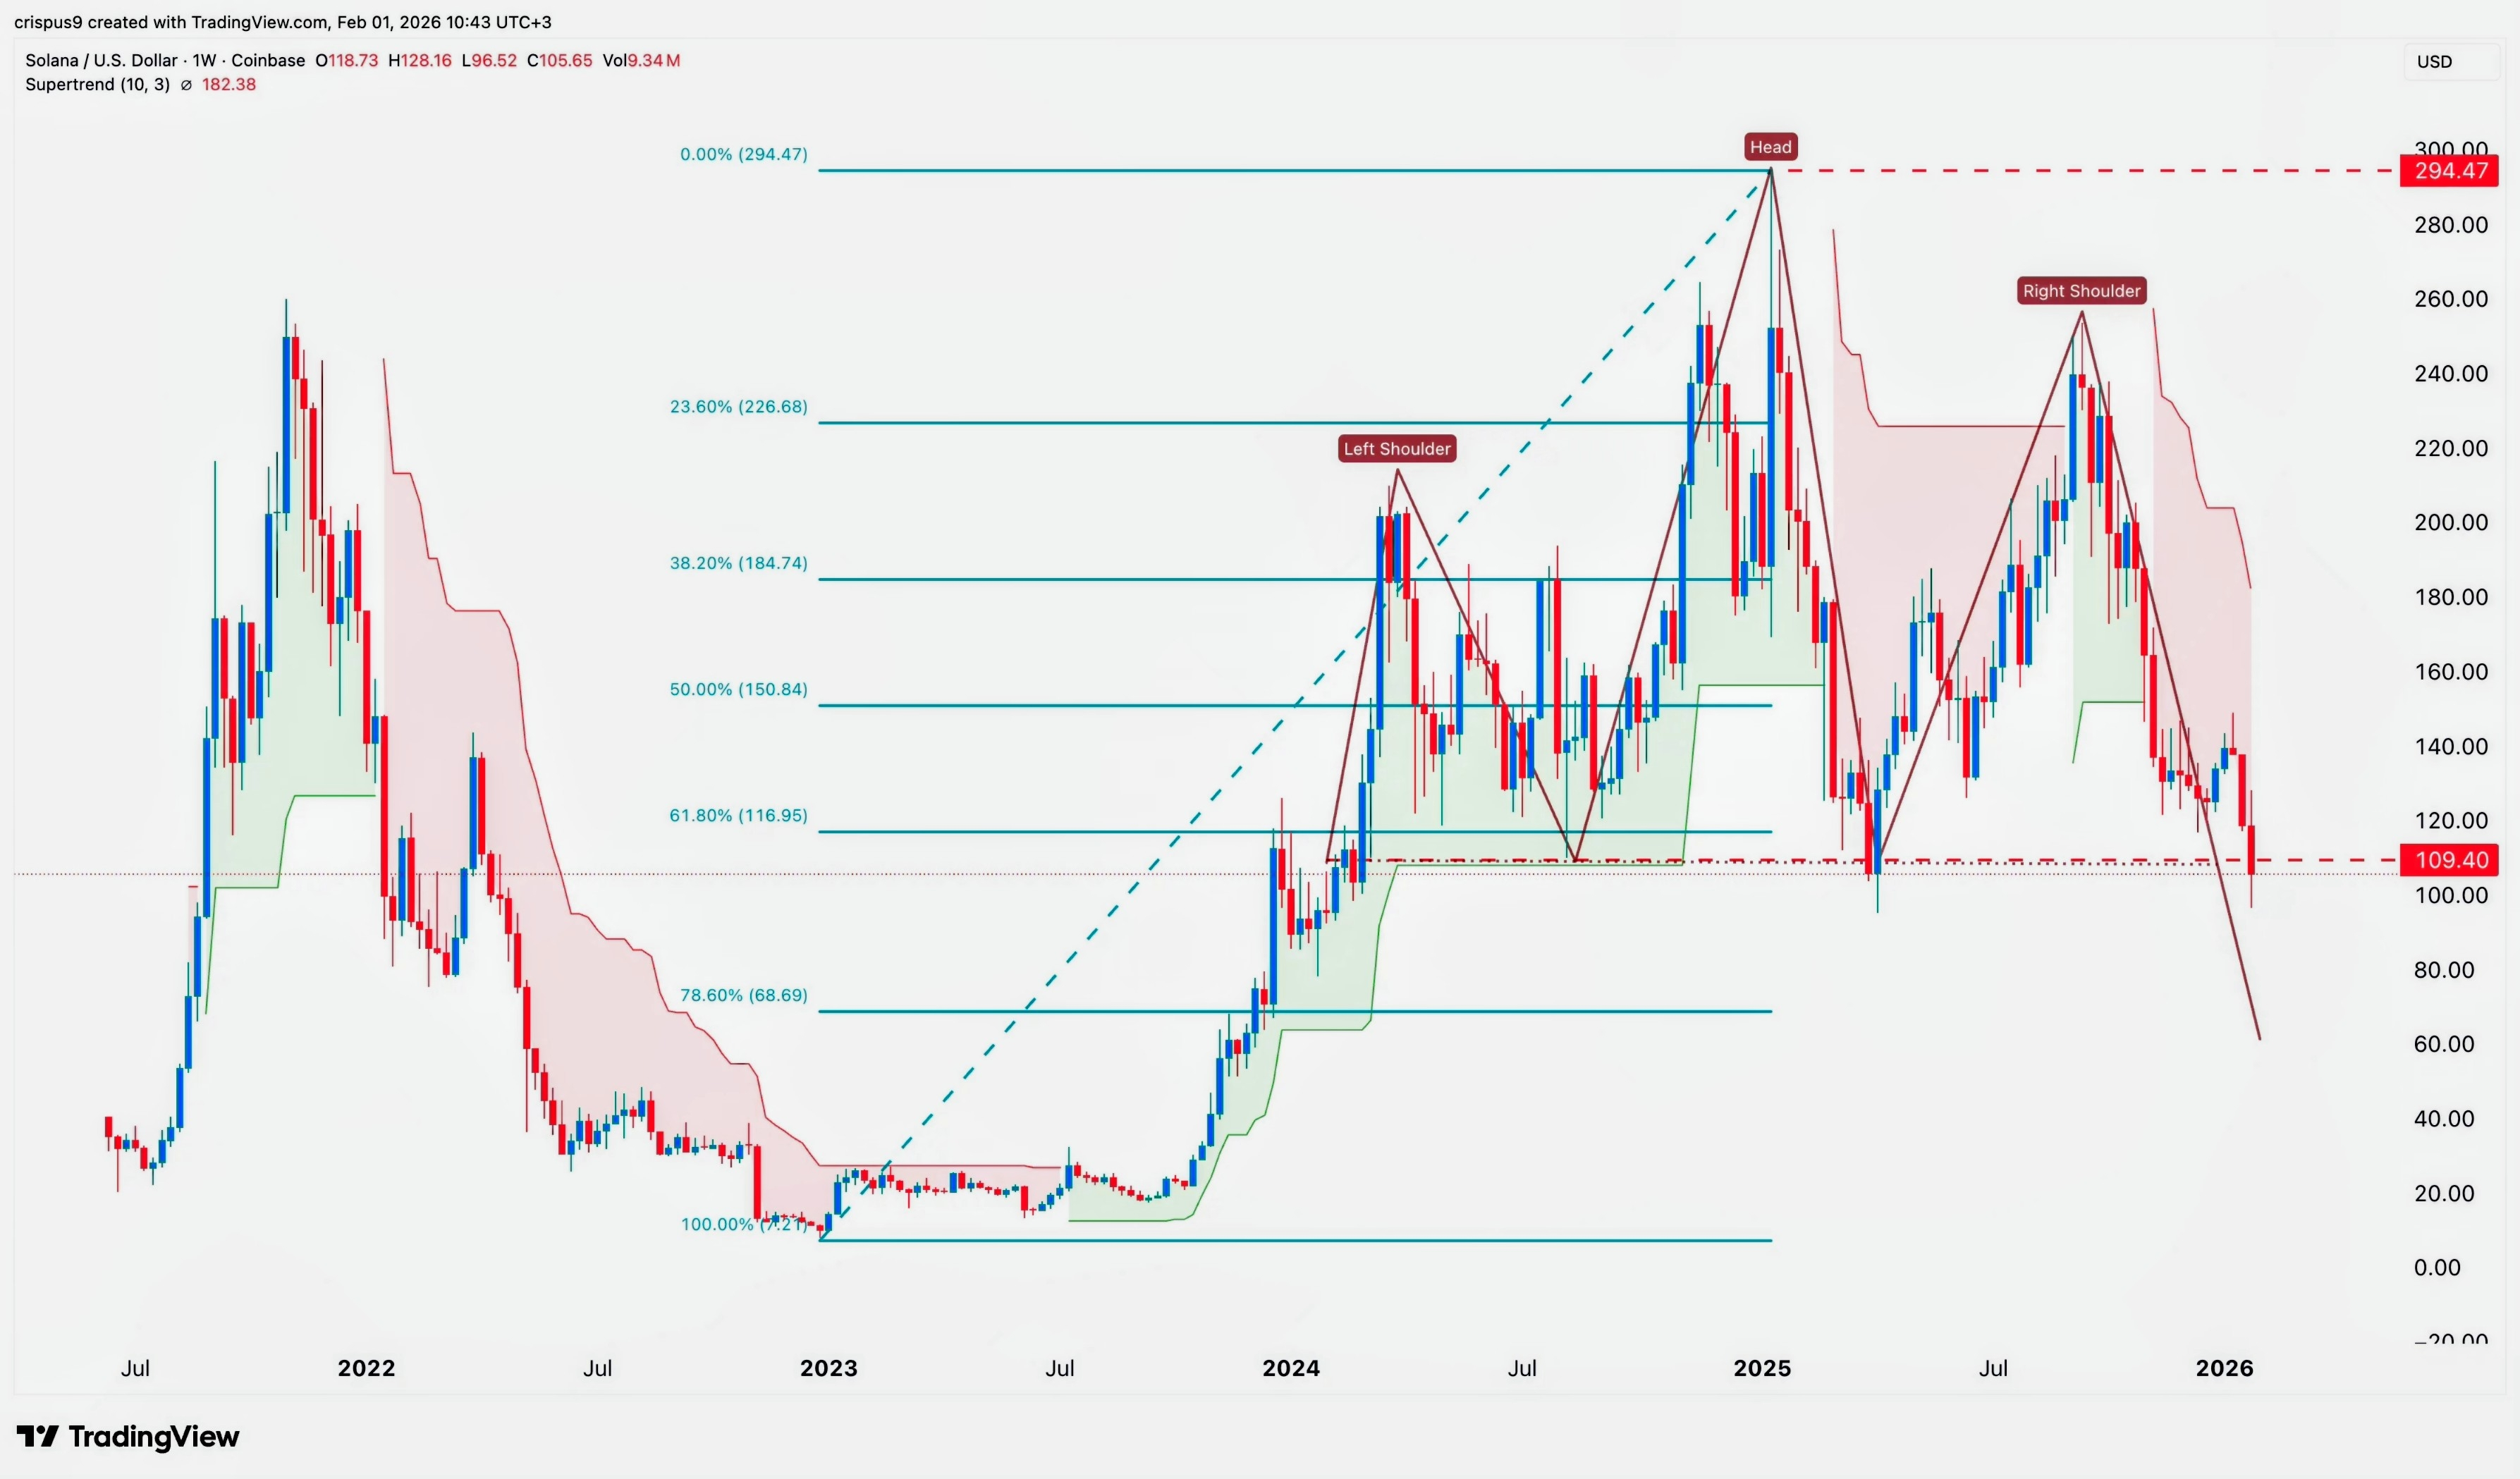
Solana, meanwhile, is flashing a multi-year head and shoulders on the monthly, with the right shoulder forming near $200. If it breaks the neckline around $150, we could see a slide to $100 or lower—bearish signal amid network upgrades hype.
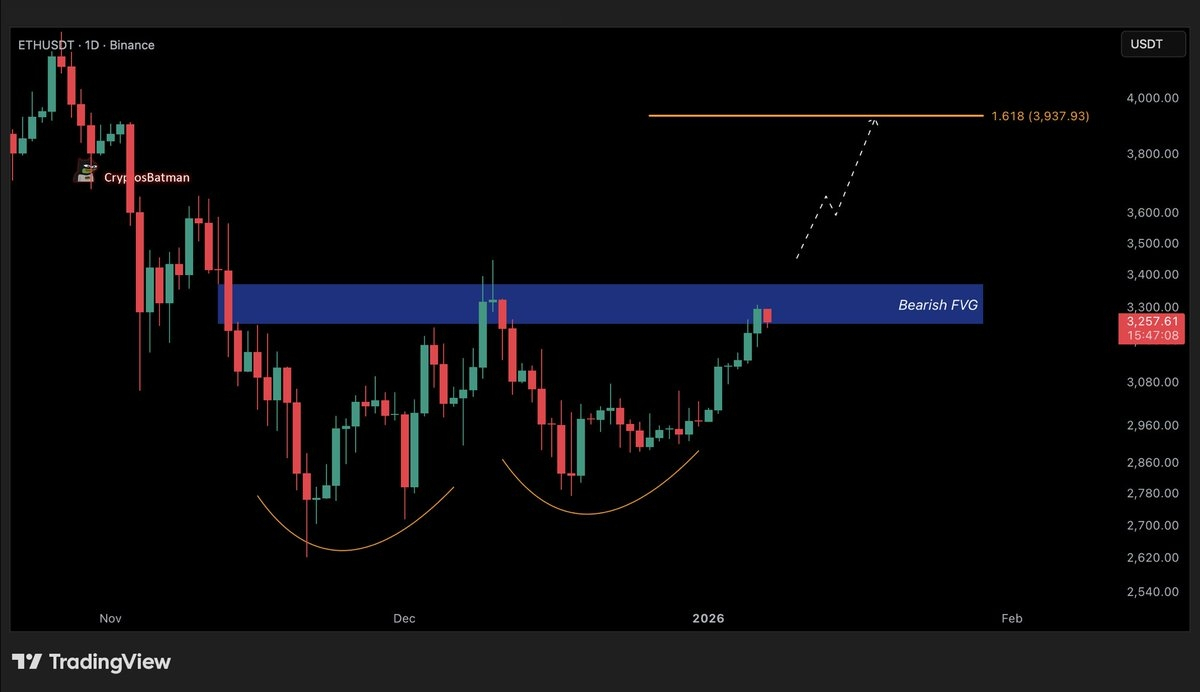
Ethereum's daily shows a double bottom near $2,700 in late 2025, breaking out in January 2026 toward $3,500. Classic reversal playing out post-merge effects.
Expert Tips for Trading Chart Patterns
Volume Confirmation: No spike on breakout? It's likely a trap. Crypto volumes can fake out due to bots.
Timeframes Matter: Patterns on daily/weekly are stronger than hourly—align them for confluence.
Risk Control: Place stops outside the pattern (e.g., below neckline for longs). Risk 1-2% per trade.
Combine with Fundamentals: In crypto, news like halvings or regulations can accelerate or bust patterns.
Practice Spotting: Use TradingView to scan historical charts—backtest to build intuition.
Chart patterns aren't foolproof, but they're a trader's edge in predicting crypto's wild swings. Study them, apply wisely, and let the market do the talking.