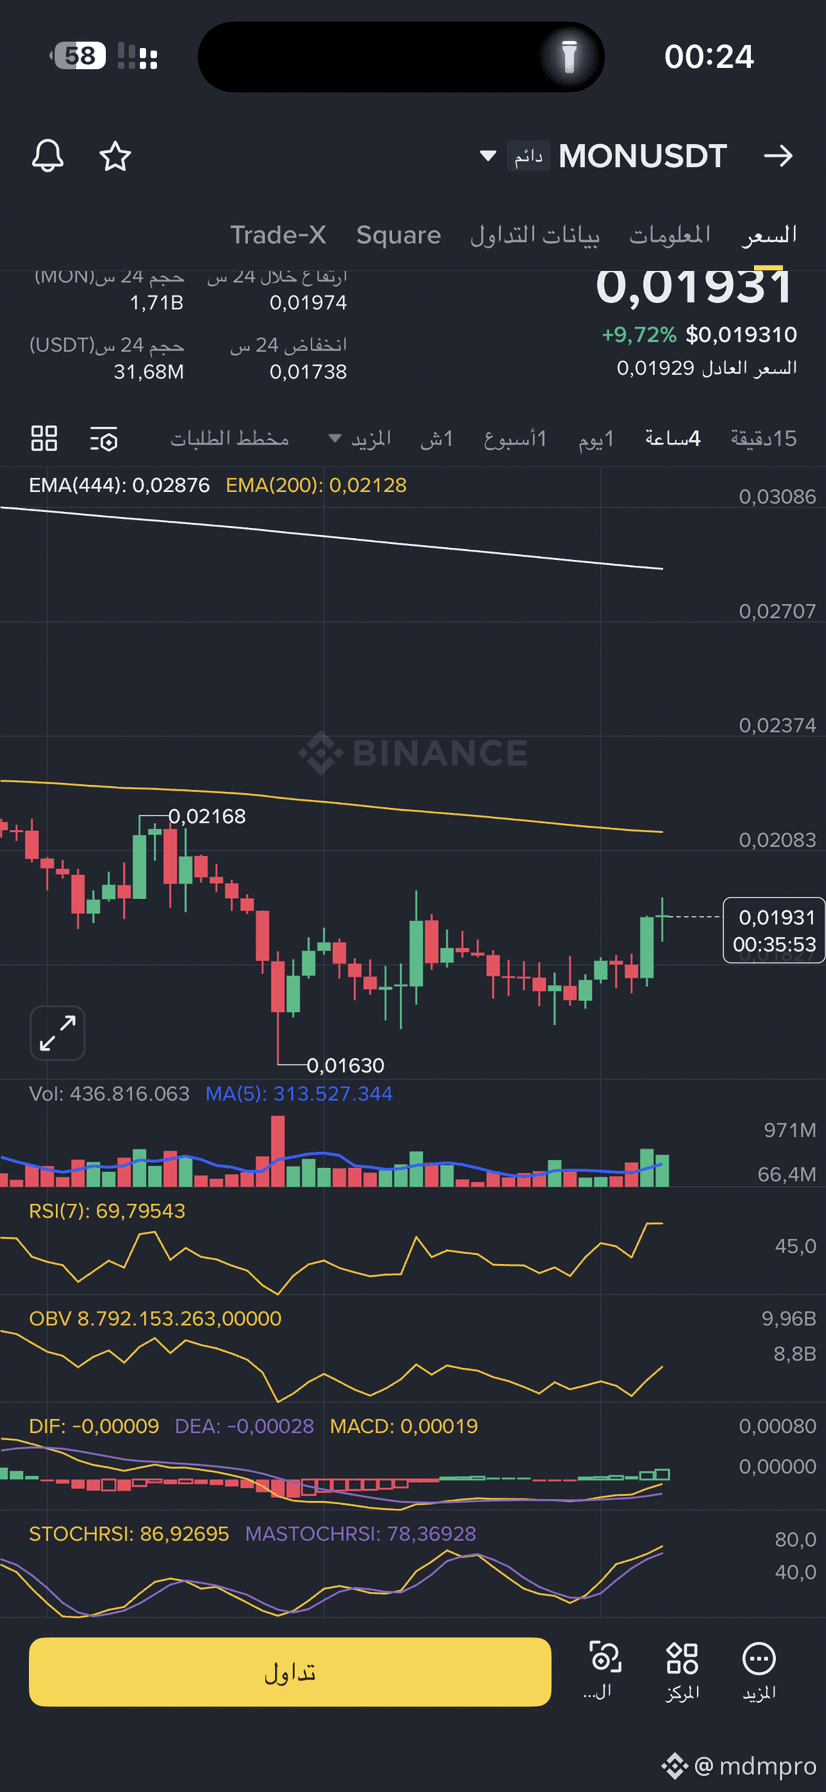
📉 Market Structure
• The overall trend is still bearish on the mid-term.
• Price is trading below EMA 200 (0.02128)
➡️ The current move is a technical rebound, not a confirmed trend reversal yet.
⸻
💰 Current Price
• 0.01931 USDT
• Strong bounce from the key support at 0.01630
• +9.7% intraday recovery
⸻
🧱 Key Levels
Support Zones
• 0.01820 – 0.01780 (minor support)
• 0.01630 (major structural support)
Resistance Zones
• 0.02080 – 0.02170 🔥 (EMA 200 resistance)
• 0.02370
• Strong resistance above at 0.028 – 0.029
⸻
📊 Indicators Analysis
RSI (7) ≈ 69.8
• Near overbought territory
• Strong momentum, but short-term pullback is possible
Stochastic RSI
• 86 / 78
• Overbought zone
➡️ Market may cool down before continuation
MACD
• Fresh bullish crossover
• Histogram turning positive
➡️ Bullish momentum is building, but still moderate
OBV (On-Balance Volume)
• Clearly rising
➡️ Confirms real buying pressure
Volume
• Above average
➡️ The rebound is volume-supported, not a fake move
⸻
🧠 Market Interpretation
• The rebound is legitimate, supported by volume and momentum.
• However, price is approaching a strong sell zone (EMA 200).
• A clean breakout above EMA 200 is required for trend reversal confirmation.
⸻
🎯 Scenarios
✅ Bullish Scenario
• Hold above 0.0190
• Break and close above 0.0217
• Targets:
• 0.0237
• 0.0260
• 0.0280 (requires strong volume)
❌ Bearish Scenario
• Rejection from 0.0208 – 0.0217
• Pullback toward:
• 0.0182
• Then 0.0163
⸻
⚠️ Trading Strategy
If you are already in:
• Consider partial profit-taking near 0.0208 – 0.0217
• Move stop-loss to 0.0185
• Avoid chasing price into resistance
If you are not in:
• No buying at resistance
• Wait for:
• A healthy pullback, or
• A confirmed breakout with strong volume
⸻
🧩 Final Note
MONUSDT is in a strong rebound phase, but still under# a bearish structure.
The real decision point is EMA 200