In 2026, Bitcoin (BTC) is more mature than before.
The market is not only moving on hype. Now, data and analytics matter a lot.
📊 Price Trend
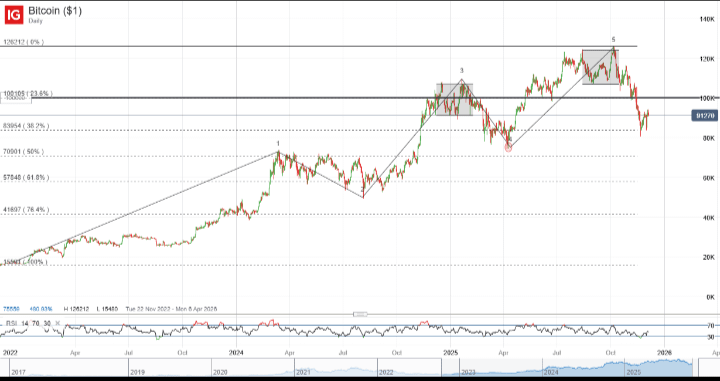
BTC price shows clear trends in 2026.
Higher price levels = bullish trend
Lower price levels = bearish trend
Most traders check daily and weekly charts to understand direction.
📈 Trading Volume
Volume shows market strength.
High volume means strong move
Low volume means weak move
Price move without volume is risky.
🧱 Support and Resistance
Support is a price level where BTC usually stops falling.
Resistance is a level where price stops going up.
Smart traders always check these levels before buying or selling.
🔗 On-Chain Analytics
On-chain data helps us see what big holders are doing.
It shows:
Are whales holding or selling BTC
Is BTC going to exchanges or leaving them
If BTC is leaving exchanges, it is a long-term bullish sign.
🏦 Institutional Role
In 2026, big companies and institutions are active in BTC.
Because of this:
Market is more stable
Long-term trend is stronger
Institutions usually invest for the long term.
Market Sentiment
Fear and Greed Index shows market emotions.
Fear = possible buying chance
Greed = time to be careful
Do not trade only on emotions.
📝 Final Thoughts
BTC analytics in 2026 helps us make better decisions.
It does not give 100% prediction, but it reduces risk.
Always use data, control emotions, and manage risk.