Why ENSO Price Is Moving Up – Technical Breakdown
ENSO’s recent move higher is driven by a clean trend reversal + strong momentum continuation, supported by EMA structure, higher lows, and expanding volume.
This is a technically healthy move, not a random spike.
🟢 1. Strong Reversal from Demand Zone
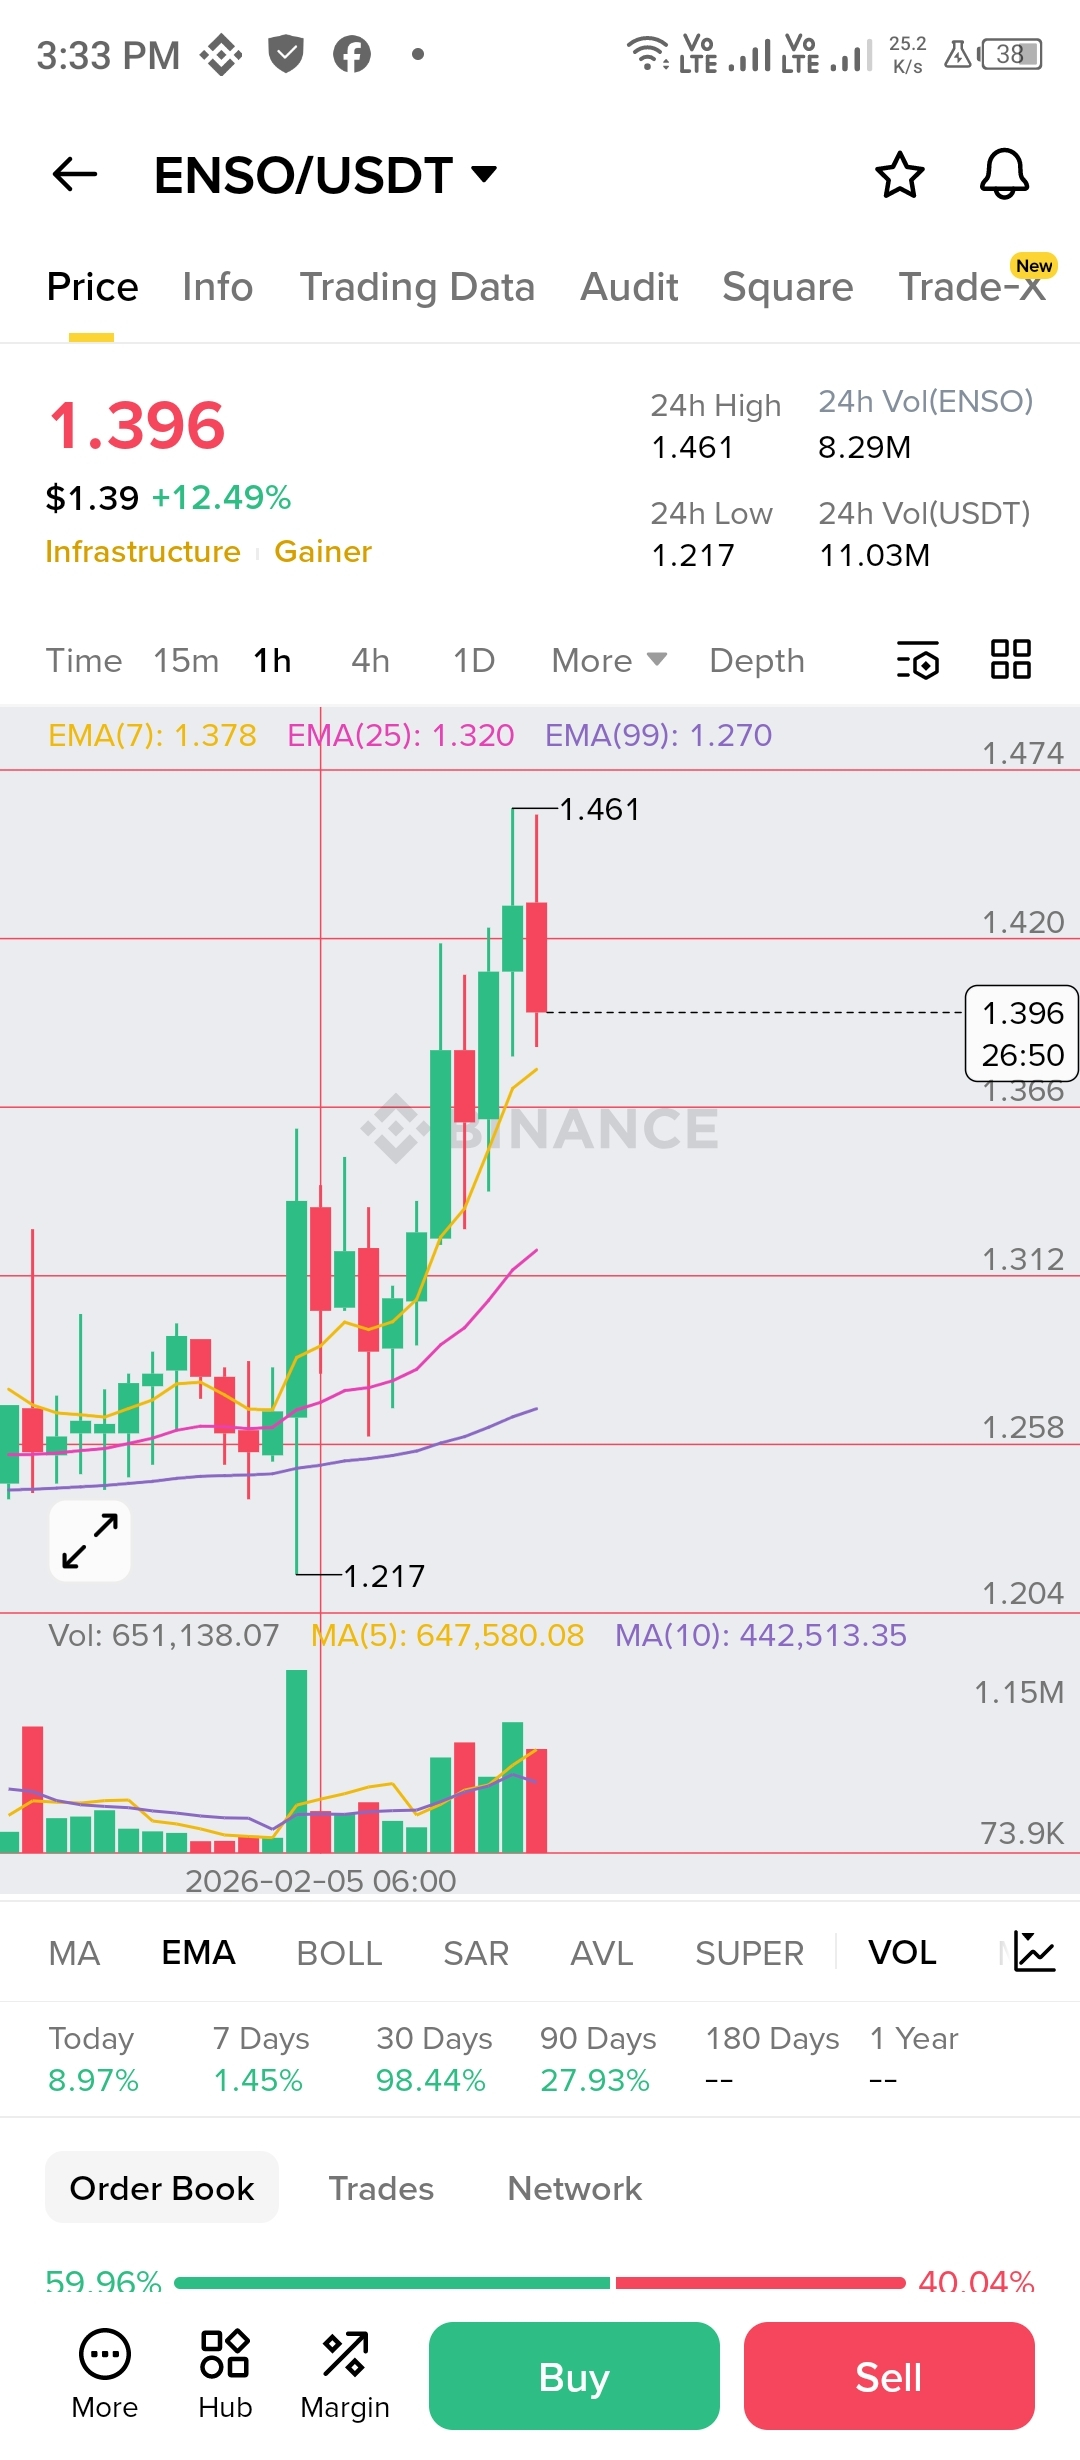
ENSO bounced sharply from the $1.21–1.25 support zone:
Previous demand area
Long lower wicks showing buy pressure
Clear rejection of lower prices
The move from $1.217 → $1.46 confirms buyers regained control.
⚡ 2. Bullish EMA Stack (1H)
On the 1H chart:
EMA(7) > EMA(25) > EMA(99)
Price is holding above all key moving averages
This structure confirms:
Trend flip from bearish → bullish
Dips are being bought aggressively
Momentum remains in favor of buyers
📊 3. Higher Highs & Higher Lows
ENSO is now forming:
Higher lows above EMA(25)
Higher highs into $1.46
This is textbook bullish market structure, not just a relief bounce.
🧠 4. Liquidity Sweep Above $1.42
The push into $1.461:
Swept previous highs
Triggered breakout entries
Forced short covering
The small pullback afterward is healthy consolidation, not weakness.
🔄 5. Infrastructure Narrative Rotation
ENSO is categorized as Infrastructure:
Capital rotating into infra & tooling projects
Traders favoring mid-cap setups with clean structure
Narrative + technical alignment often leads to sustained moves.
🔍 Current Structure (Around $1.39)
ENSO is now:
Consolidating above breakout zone
Holding bullish structure while above $1.36–1.37
📌 Key Levels to Watch
Support: $1.36 / $1.31
Resistance: $1.46 / $1.52
Break & hold above $1.46 → continuation likely
⚠️ Loss of $1.31 would weaken momentum short term.
🧩 Conclusion
ENSO is moving up because of: ✔️ Strong demand-zone reversal
✔️ Bullish EMA alignment
✔️ Clean HH/HL structure
✔️ Volume-backed breakout
✔️ Sector rotation into infrastructure
As long as price holds key support, trend remains bullish.