
BNB, the native asset of the BNB Chain ecosystem, is one of the most utility-driven cryptocurrencies in the market. It started as an exchange token but has evolved into a full ecosystem fuel powering DeFi, GameFi, NFTs, and smart contract infrastructure. Today, BNB is used for transaction fees, staking, governance, and decentralized application activity across the BNB Smart Chain, opBNB Layer-2, and Greenfield storage network.
From a fundamental perspective, BNB is designed with strong tokenomics. The supply is deflationary due to regular token burns that permanently remove coins from circulation. The long-term goal is reducing supply from 200 million to 100 million BNB, which creates scarcity pressure that can support price value over time.
Technically, BNB Chain runs on Proof of Staked Authority (PoSA), combining Proof of Stake and Proof of Authority. This hybrid model allows fast block times (around 3 seconds) and low transaction costs, making it attractive for developers and users compared to slower chains.
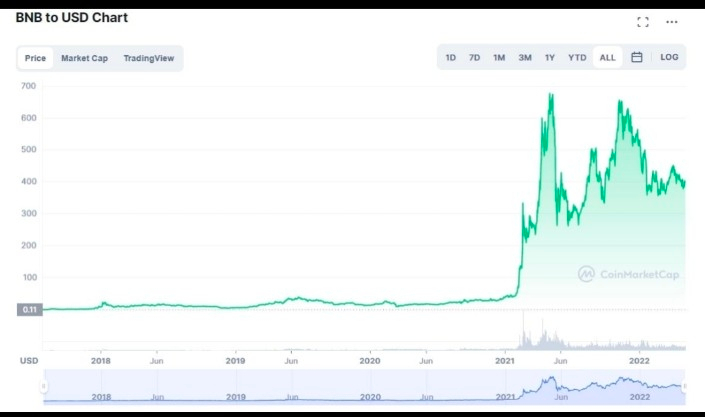
Looking at chart behavior historically, BNB often moves in strong trend cycles. During bull phases, price tends to form parabolic moves followed by consolidation channels. In correction phases, BNB usually respects key support levels before continuation. Chart structures often show ascending channels, moving average support, and strong volume spikes during breakout phases.
In ecosystem terms, BNB is not just a speculative asset. It is required for Launchpad participation, staking rewards, DeFi liquidity provision, and paying network gas fees. This creates constant real demand instead of purely trading demand.
Overall, BNB Chain remains one of the most active blockchain ecosystems, combining strong fundamentals, real utility demand, and historically strong market cycles. If adoption, DeFi growth, and ecosystem expansion continue, BNB is likely to remain a core infrastructure asset in the crypto market landscape.
Current BNB Burn + Chart Market Context (2026 Latest)
The latest confirmed burn event happened January 15, 2026, which is currently the most recent on-chain burn data available.
Latest Burn Key Data (34th Quarterly Burn):
• 🔥 Burned: 1,371,803.77 BNB
• 💰 Value at burn time: ~$1.27 Billion
• 📉 Remaining Supply: ~136.36 Million BNB
• ⛓ Burn sent to permanent “dead wallet” address
This was the first burn of 2026, continuing BNB’s long-term deflation strategy.
BNB uses quarterly auto-burn plus real-time gas-fee burn (BEP-95). Around 281K BNB already burned from gas fees mechanism alone, meaning supply keeps shrinking continuously — not just quarterly.
Current Chart Structure (2026 Market Behavior)
Recent technical data shows mixed structure:
• BNB recently dropped with overall market crash
• Fell ~8% daily and ~11% weekly during market sell-off
• Found support around $830–$860 zone
• Resistance sits around $910–$928 area
• RSI showing oversold recovery signals
This means chart is currently in correction → stabilization phase, not full bearish trend yet.
What Burn Means For Chart Long Term
Burn = Supply Down
Supply Down + Demand Same or Up = Price Support
Historically, BNB burn cycles support long-term bullish structure because circulating supply keeps shrinking while ecosystem usage grows (DeFi, gas, staking, Launchpad demand).
Market Interpretation (Trader View)
Right now structure looks like:
• Short term → Volatility + recovery attempts
• Mid term → Depends on BTC trend + ETF news + ecosystem activity
• Long term → Burns + utility = structural bullish bias


