

Bitcoin is facing sharp decline while RWAs like Gold and silver are printing consecutive gains.
Bitcoin Technical Analysis and Price Forecast.
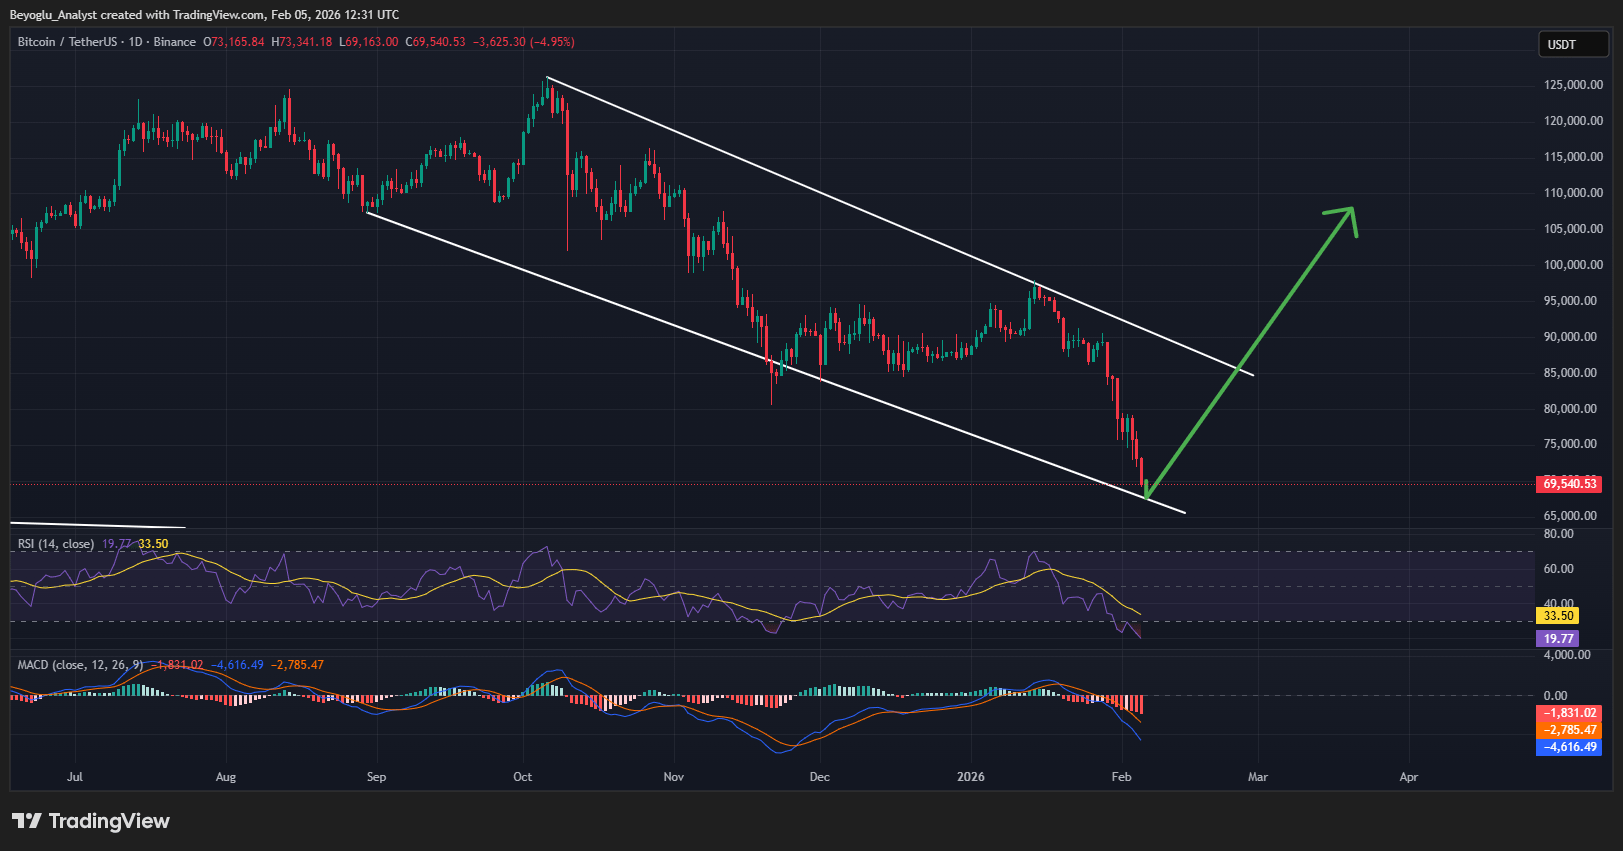
$BTC is moving inside a falling wedge chart pattern, and near to retest the support trend line at $68,000-$69,000. If Bitcoin will make a pullback then the price could surge to $85,000. and If break down the Trend the the price could fall to $64,000.
The weekly RSI is at 29 on weekly timeframe same as when the bitcoin was $15,500 indicating a strong pullback ahead. while the Daily RSI is at 19 in over sold region indicating the bear hold in the market. MACD is also showing bearish momentum in Bitcoin.
Gold Technical Analysis and Price Forecast:
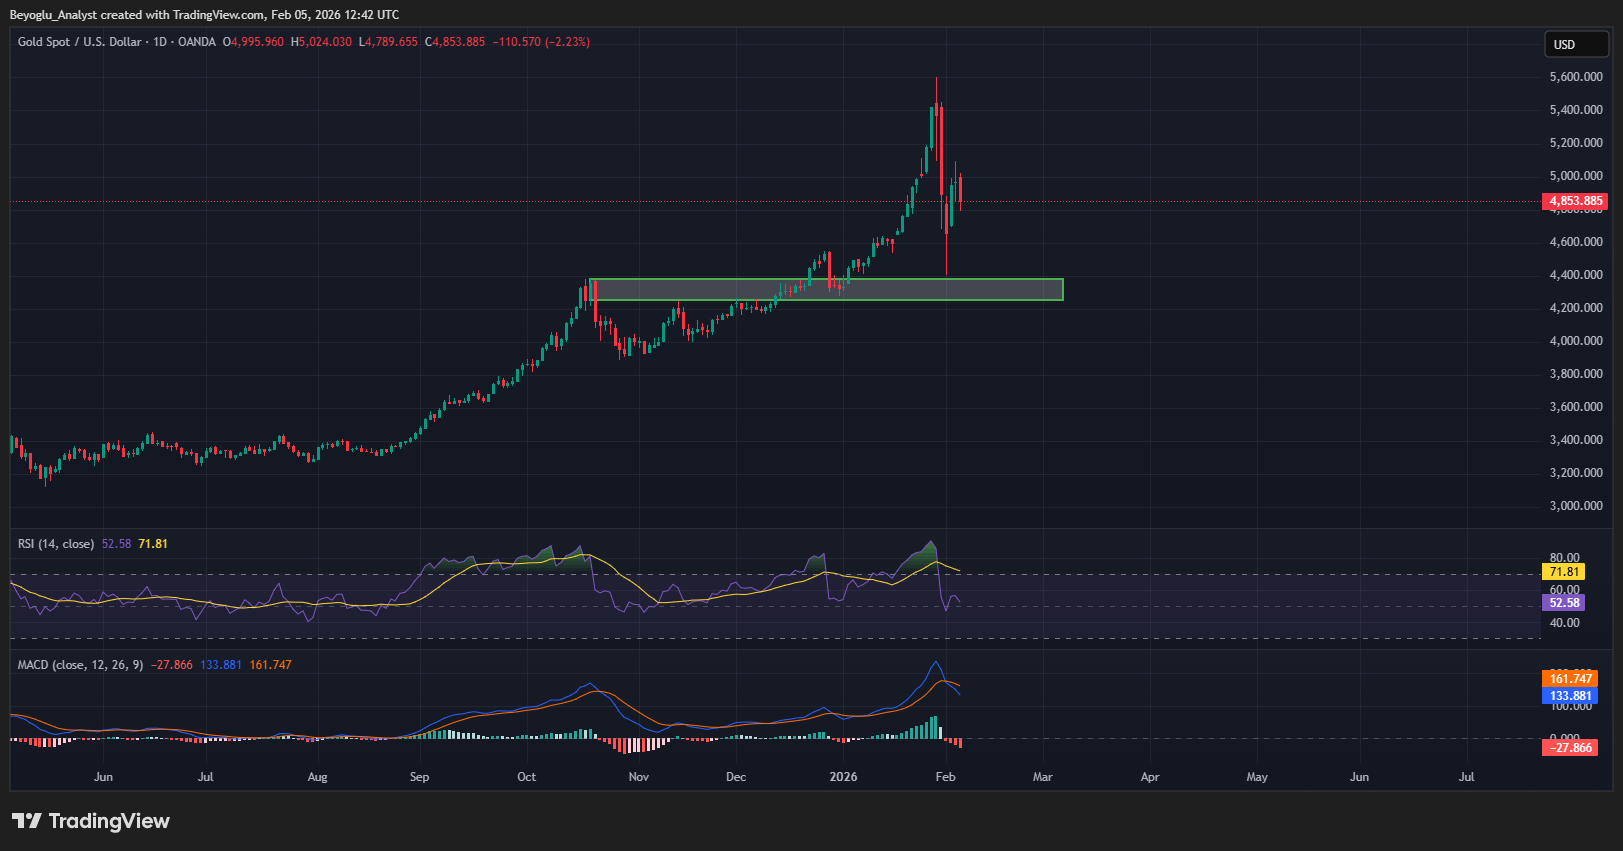
$XAU facing strong price decline. The price has been drop nearly 4% today. trading near $4,850. The XAU face rejection from $5,100 yesterday and the prices are continuously facing decline. If the Gold make a day close below $5,000 then the price could continue decline towards $4,550.
The Relative Strength Index RSI is at 52 higher then the level of neutral aiming downward indicating that the bullish momentum is fading away. The Moving Average Convergence Divergence MACD Orange line has flip the blue line forming strong red histogram indicating that the momentum is being shift from bullish to bearish.
P.S not a financial Advice do your own research