The cryptocurrency market extended its selloff for a third consecutive session on Thursday, February 5, 2026, as mounting macro pressure and a massive liquidation cascade pushed prices to multi-month — and in some cases multi-year — lows.

Bitcoin (BTC) dropped as much as 3.5%, briefly testing the $70,000 level for the first time since November 2024 before stabilizing near $71,340.
XRP plunged more than 7%, slipping below $1.40.
Ethereum (ETH) fell to $2,068, its weakest level since May 2025.
Dogecoin (DOGE) continues to fight for survival at the key $0.10 support zone.
The sharp move lower was amplified by approximately $775 million in leveraged liquidations, intensifying downside momentum across the entire crypto complex.
Below is a breakdown of why crypto is going down today, followed by technical analysis for Bitcoin, Ethereum, XRP, and Dogecoin.
Why Is Crypto Going Down Today?
1. $775 Million Liquidation Cascade
The immediate catalyst for Thursday’s crash was a large-scale liquidation event. As Bitcoin slipped below key technical support near $74,000, long positions across perpetual futures markets were forcibly closed.
Open interest had surged to unsustainable levels in recent sessions, driven by retail FOMO and aggressive leverage. Once BTC broke lower, algorithmic selling accelerated the decline, triggering a cascade of liquidations that wiped out over 165,000 traders, most of them positioned long.
This follows the February 1 “Black Sunday II” event, which saw $2.2 billion liquidated in a single day — the largest wipeout since October 2025.
2. Hawkish Federal Reserve Expectations
Macro pressure continues to weigh heavily on risk assets.
Markets are pricing in a more hawkish Federal Reserve outlook following reports surrounding Kevin Warsh’s potential appointment as Fed Chair. Expectations that the Fed may pursue balance sheet reduction and keep interest rates elevated have strengthened the U.S. dollar, pushing the DXY above 97.5.
With real yields remaining high and Jerome Powell reiterating that the Fed is “not in a hurry to cut,” speculative assets like cryptocurrencies remain under sustained pressure.
3. Institutional Outflows Drain Liquidity
Institutional selling has added another layer of downside pressure.
Spot Bitcoin ETFs have seen continued outflows, with approximately $373.8 million exiting recently. Since mid-January, cumulative ETF outflows have reached multi-billion-dollar levels, removing critical spot demand and forcing additional deleveraging in derivatives markets.
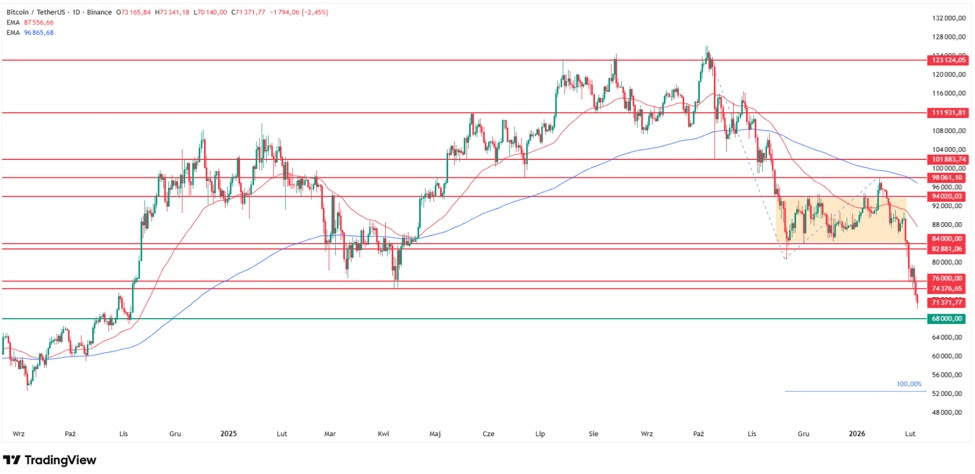
Bitcoin Price Analysis: Breakdown Below $74K Opens Path to $68K
Bitcoin’s failure to hold above $74,000 marks a decisive technical breakdown. After testing $70,052, BTC has recovered modestly to $71,340, but remains firmly below prior support.
This confirms the bearish scenario I’ve been preparing for since November. The next major downside target is $68,000, where the 200-week exponential moving average (EMA) sits — a level that historically attracts strong demand.
If $68,000 fails to hold, the longer-term ultra-bearish target comes into focus near $52,000, aligning with the 100% Fibonacci extension of the current trend.
Bitcoin is now approximately 45% below its October peak near $126,000, shattering the widely held belief that sub-$100K prices would never be revisited.
XRP Price Analysis: Below $1.40, Eyes on $1.25 — or $0.53
XRP is experiencing one of its sharpest declines of the year, falling more than 7% and breaking below $1.40 — its lowest level since November 2024, excluding October’s flash crash.
The loss of support defined by April 2025 lows opens the door toward the $1.25–$1.26 zone, corresponding to the October flash crash bottom. Failure there would expose a much deeper long-term target near $0.53.
To invalidate the bearish outlook, XRP would need to reclaim $2.20, where the 200-day EMA currently resides — a move that would require a rally of nearly 60% from current levels.
Dogecoin Price Analysis: $0.10 Is the Last Line of Defense
Dogecoin continues to underperform, hovering around the psychologically critical $0.10 level — its lowest price since September 2024.
DOGE already lost key support near $0.12 at the end of January and remains under persistent selling pressure. A confirmed breakdown below $0.10 would likely trigger a move toward $0.08, the 2024 cycle low.
Meaningful relief would only emerge if Dogecoin can reclaim $0.16, where the 200-day EMA acts as major resistance.
Ethereum Price Analysis: Testing Key Support at $2,100
Ethereum fell to $2,068, marking its lowest price since May 2025. While ETH has stabilized slightly near $2,132, downside risks remain elevated.
Support near $2,100, defined by June 2024 lows, is currently being tested. A breakdown would expose the next downside targets at $1,760 (March 2025 lows) and ultimately $1,400 (April 2024 lows).
From a pattern perspective, Ethereum remains vulnerable to an inverted cup-and-handle breakdown, which points toward a downside target near $1,725 — a level that could be reached as early as February if bearish momentum persists.
The bearish thesis would be invalidated only if ETH reclaims the $2,750–$3,430 consolidation range from late 2025.
Key Technical Levels to Watch
Asset
Current Price
Next Target
Ultra-Bearish Target
Bull Invalidation
$71,340
$68,000 (200-week EMA)
$52,000
Above $84,000
Below $1.40
$1.25–1.26
$0.53
Above $2.20
$2,132
$1,760
$1,400
$2,750–$3,430
Dogecoin
$0.10
$0.08
—
Above $0.16
Bottom Line
The current crypto selloff is being driven by a toxic mix of leverage unwinding, hawkish macro expectations, and institutional outflows. Until liquidation pressure subsides and key technical levels are reclaimed, downside risks remain elevated across the board.
#XRP
#DOGE