Updated Charts, Same Macro Structure
My previous analysis for $BTC was published shortly before the end of 2025. At that time, I assumed that the yearly candle would close green and below the 2024 mid-high. Instead, the annual time frame is now showing a very different scenario.
📊 Annual Timeframe Overview
On the annual chart, three upward impulse waves are clearly visible, with deep pullbacks after the first two impulses.
The third upward impulse, which started in 2023, ended at the 2025 all-time high of 126,199.63.
The 2025 close formed a red candle with a large upper tail, which statistically points to a higher probability of a correction phase rather than an immediate continuation of the bullish move.
I still assume we will see a test of the 2024 mid-high at 108,353.00, which lies just below the 50% level of the 2025 annual candle’s upper tail at 109,887.87.
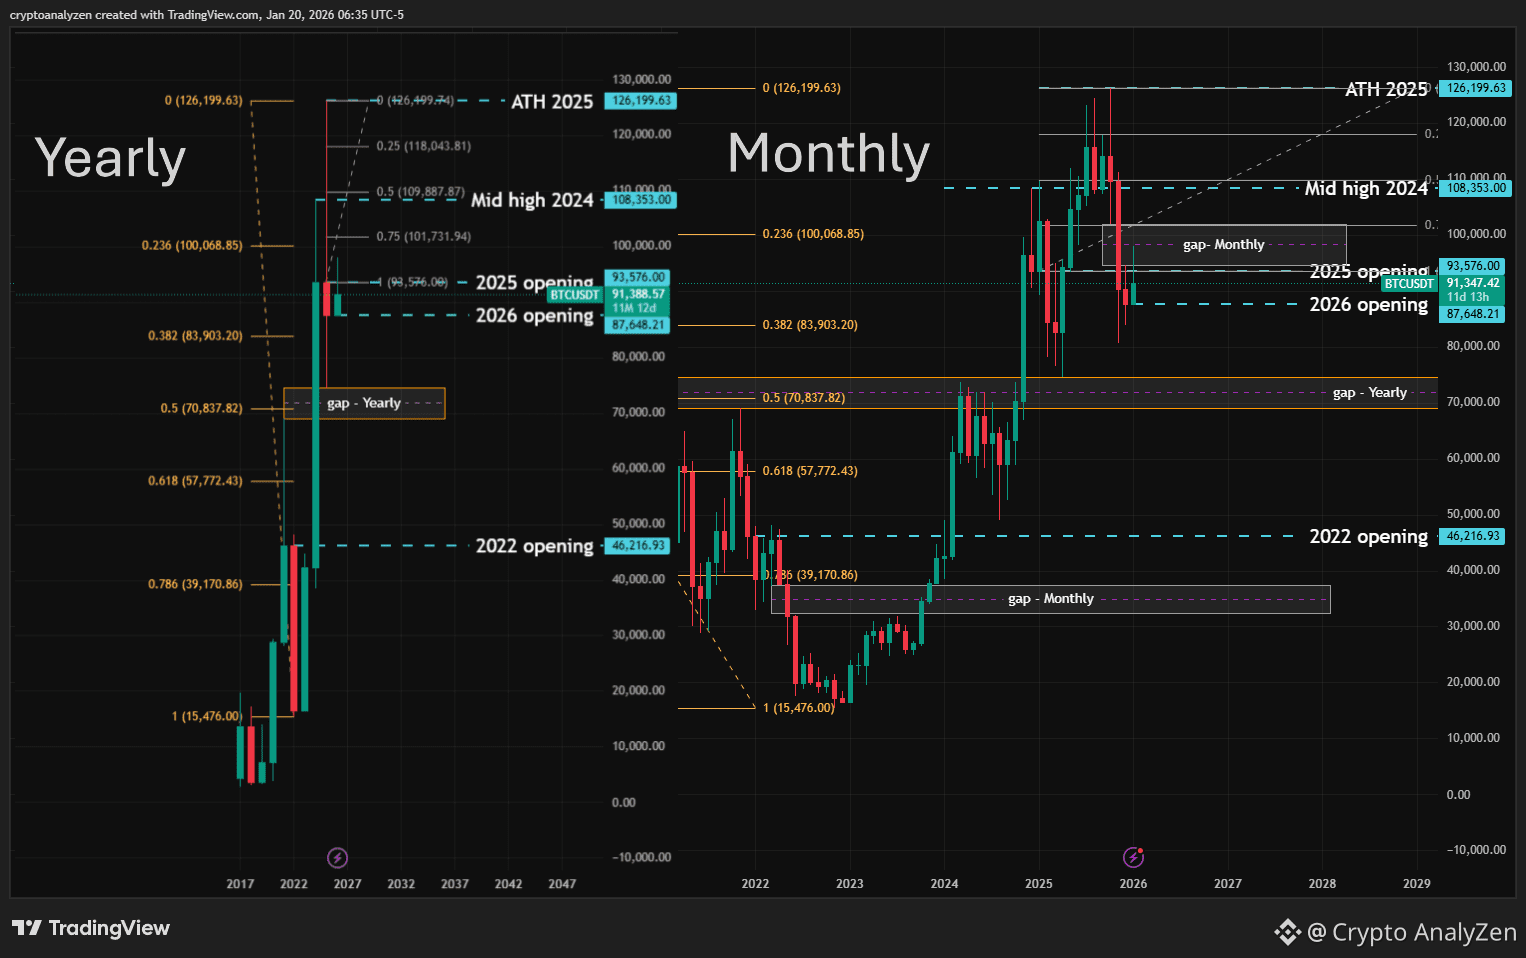
📅 Monthly Structure & Gap Analysis
In the first two weeks of the new year, there were attempts to break above the 2025 opening level at 93,576.00.
On the monthly chart, there is a gap between the October 2025 low (102,000.00) and the December 2025 high (94,588.99).
The lower boundary of this gap has already been tested during the first weeks of 2026.
If this gap zone is convincingly reclaimed, price may move toward 108,353.00.
🔻 Downside Structure & Key Zone
If price moves downward, attention shifts to:
• The 2026 opening level — 87,648.00
• The lower tail of the 2025 annual candle — 74,508.00
The most important zone remains the gap between the 2025 low (74,508.00) and the 2021 all-time high (69,000.00).
This zone also corresponds to the 50% Fibonacci retracement of the entire impulse from 15,476.00 to 126,199.63.
If this main zone fails to hold, even lower levels and deeper gap fills remain possible.
🎯 Key Levels to Watch
🔼 Upside Scenario
• Gap zone: 94,588.99 – 102,000.00 → opens path to 108,353.00
• 109,887.87 → 50% of the 2025 upper tail (major resistance area)
🔽 Downside Scenario
• 2026 opening level — 87,648.00
• Lower tail of 2025 candle — 74,508.00
• Main gap zone: 74,508.00 – 69,000.00
(50% Fibonacci of 15,476.00 – 126,199.63)
📌 Structure first. Levels second. Emotions last.
This outlook is based on multi-timeframe market structure, not short-term noise.
