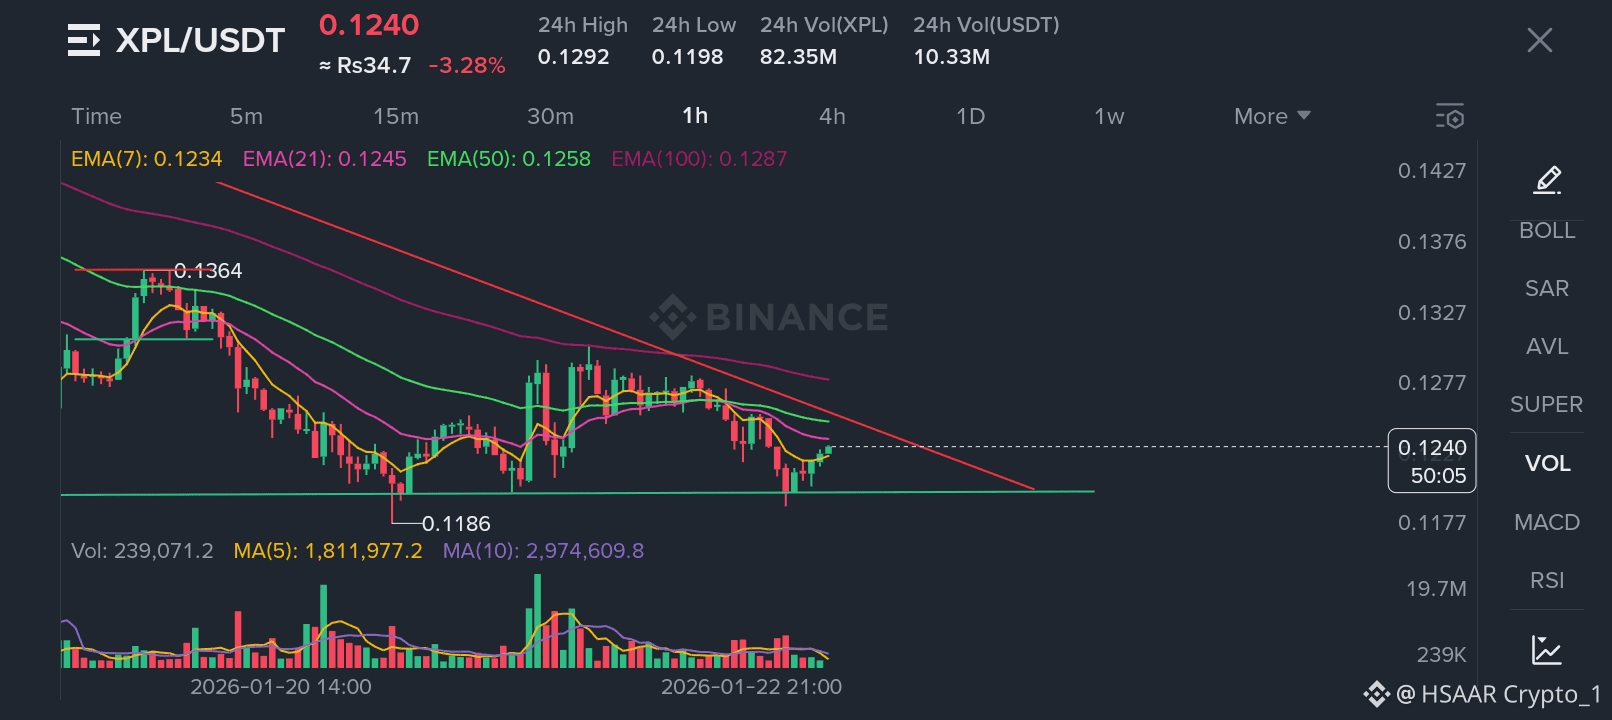
This chart for XPL/USDT, likely on a 5-minute to 1-hour timeframe, shows that the price is currently at 0.1240, having decreased by 3.28% over the last 24 hours. The 24-hour high was 0.1292 and the low was 0.1198. The trading volume for XPL in the past 24 hours was 82.35M. 📉
From a technical perspective, the price is currently below the 📉
EMA(21) at 0.1245,
EMA(50) at 0.1258,
EMA(100) at 0.1287, and barely above EMA(7) at 0.1234.
This indicates a short-term bearish trend as the shorter-period EMAs (7 and 21) are mostly below the longer period EMAs (50 and 100), and the price is also below the longer period EMAs.
The price has been in a downtrend since hitting a local high of 0.1364 around January 20th, 14:00.
There's a clear descending trendline (red line) acting as resistance, which the price has been unable to break above.
The price also hit a recent low of 0.1186. The volume indicators show fluctuating activity, with some spikes around price movements.
Note. DYOR before Trade.
What is your strategy tell me in comment section 👇


#Plasma @Plasma #BinanceSquare #TechnicalAnalysiss