📉 AVAX (Avalanche) Market & Elliott Wave Structure Overview
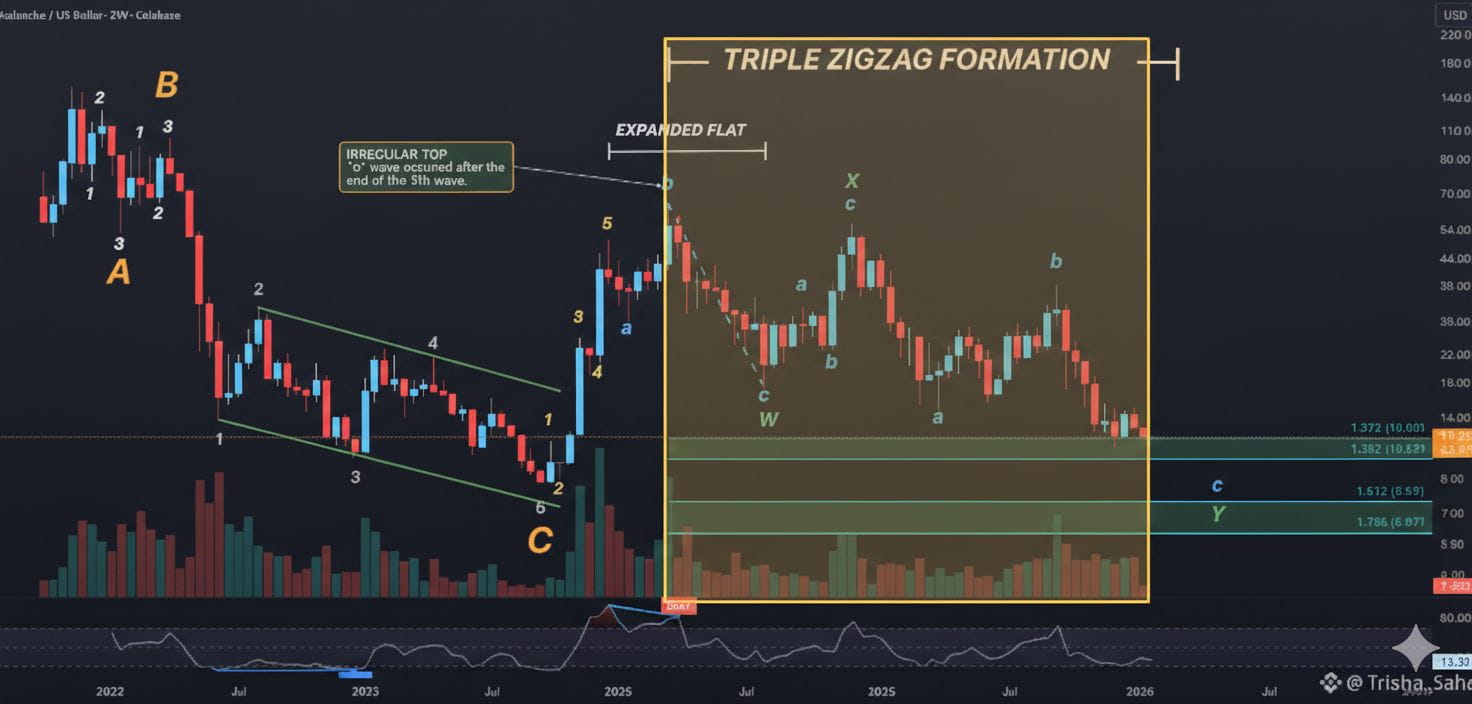
Avalanche’s native token AVAX appears to be navigating a complex corrective pattern on higher timeframes — potentially a Triple Zig-Zag correction — while lower timeframes show nested fractal corrective structures that align with classic Elliott Wave geometry.
On the weekly and daily charts, price action shows multiple overlapping ABC corrections and impulsive legs that suggest a deeper and prolonged corrective regime. These corrections are currently aligning with key Fibonacci pocket ratios, highlighting important decision zones where reversal or continuation dynamics could play out.
📊 High-Timeframe Elliott Wave Context
$AVAX may be forming a Triple Zig-Zag — three connected ABC corrective patterns — which places emphasis on expansion targets around 1.272 and 1.618 relationships from previous legs of the structure (such as the “W” wave × 0.618).
The 1.272 pocket has provided temporary support, but the 1.618 ratio is a more commonly respected extension if this corrective structure continues.
A break below these ratios would suggest structural failure and a deeper continuation of the downtrend.
Key Technical Levels & Market Context
Current price data and key levels from multiple sources help anchor this Elliott interpretation into real price zones:
Current Price & Volume
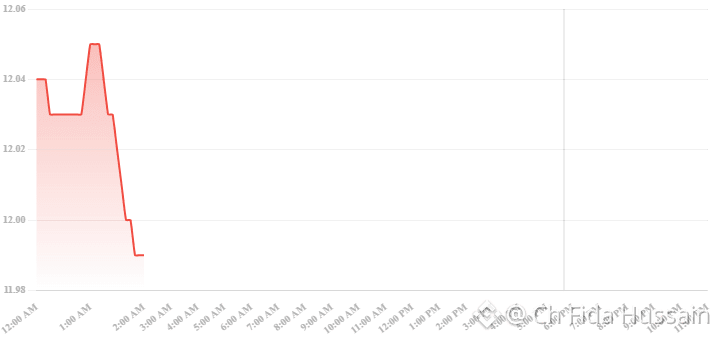
$AVAX is trading around $11.99 with mixed momentum after recent volatility.
Support Zones
Near-term support clusters around $12.08–$12.82, with the strongest at $12.08–$12.57.
Larger structural supports historically include $17, $19, $21, and $22 — these act as pivot floors if downside continuation resumes.
Resistance & Distribution Levels
Overhead resistance remains at $13.56, $14.05, and $14.30.
On broader timeframes, layers above $20–$23 become key supply walls before any sustained upside can materialize.
📊 Market Narrative & Sentiment
Recent directional behavior shows a bearish pressure at lower levels, with limited buying conviction despite localized rebounds.
Some analysts highlight stabilization scenarios and falling-wedge patterns near key supports, but these require confirmation via breakouts and volume expansion.
📈 What This Means for Traders
Bearish Scenario:
If $AVAX loses the fractal supports and continues below the Golden Window, expect continuation deeper into the corrective structure.
Watch for a break below key support confluence (like the 1.618 extension of the current wave) to signal deeper drops.
Bullish Scenario:
If price finds firm support and begins rallying above short-term resistance levels (e.g., $13.56 → $14.30), it could mean the corrective low is in and a strategic retracement or trend change is underway.
⚡ Final Notes
Your Elliott Wave breakdown adds advanced structure insight — fractals within fractals are common in deep corrective sequences.
Always combine multiple technical tools (Fibonacci zones, liquidity sweep patterns, volume profile) with context from higher timeframes.
Make decisions with reference to key invalidation levels (e.g., $12.49) and evolving market structure rather than fixed price targets alone.
This publication is educational only and should not be construed as trading advice.
#GrayscaleBNBETFFiling #AVAX✈️


