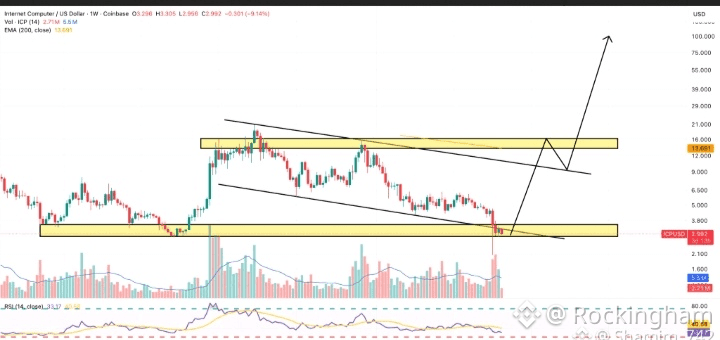
🚀 Internet Computer (ICP) Technical Analysis Is ICP Gearing Up for a Massive Breakout? $ICP Looking at the weekly chart for ICP/USD, we are seeing a textbook Falling Wedge pattern. Historically, this is one of the most reliable bullish reversal structures in crypto trading. 📊 Key Technical Highlights: Strong Support Zone: Price is currently hovering inside a major demand zone (the yellow box) between $2.90 – $3.50. This area has historically acted as a floor. The Falling Wedge: We are approaching the apex of the wedge. A breakout above the upper resistance line could trigger a significant rally. Price Targets: * Mid-term: A push toward the $16.00 resistance level. Long-term: If the momentum sustains and breaks past previous highs, the chart projects a target toward the $100 mark. RSI Indicator: The RSI is sitting in a low territory, suggesting that the selling pressure is exhausted and a relief bounce or trend reversal is overdue. 💡 Strategy & Outlook: We are currently in a high-interest accumulation zone. If the price successfully breaks out and retests the trendline, it could confirm the start of a new bullish cycle. Keep a close eye on the volume during the breakout! ⚠️ Disclaimer: This is for educational purposes only and not financial advice. Crypto markets are highly volatile; always do your own research (DYOR) before investing. #icp #CryptoAnalysis #TechnicalAnalysis #Bullrun #Web3 💥