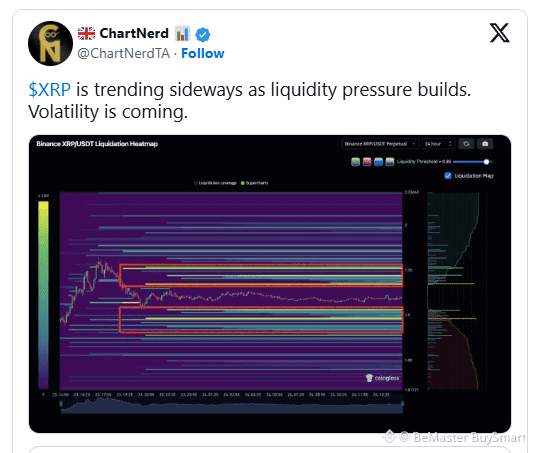
$XRP has entered a period of sideways movement, signaling that liquidity pressure is accumulating. Recent analysis by crypto analyst ChartNerd (@ChartNerdTA) highlights this development on the Binance XRP/USDT liquidation heatmap. The asset is trading within defined ranges while the market prepares for its next phase of momentum.
👉Liquidity Clusters Form Key Levels
The liquidation heatmap shows that XRP is consolidating between $1.9 and $1.95. These zones have significant liquidity, with large clusters of open positions concentrated around these price points. The map highlights areas of potential liquidation that could trigger accelerated movements once the price breaches either level.
The horizontal green and yellow bars indicate supercharts, showing where traders have concentrated leveraged positions. The proximity of these clusters indicates that any breakout or breakdown could produce sharp, short-term movements.
👉More Signals to Watch
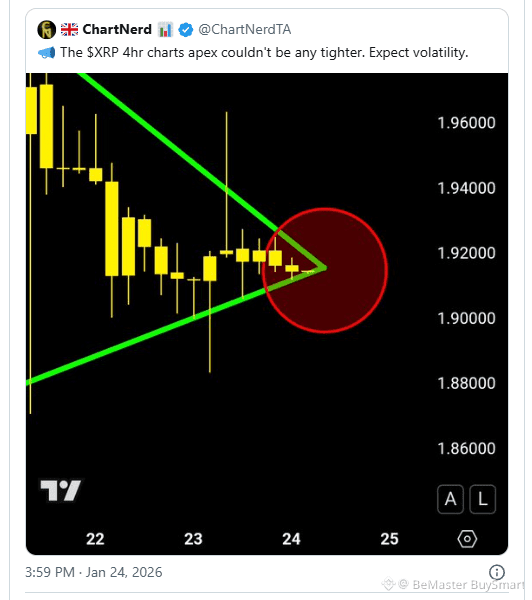
This consolidation follows a previous observation by ChartNerd, which identified XRP at the apex of a symmetrical triangle. The asset’s price compressed into a narrowing range before reaching the current sideways pattern. This pattern suggests that market participants are balancing long and short positions while preparing for a directional move.
The current liquidity concentration aligns with the triangle apex, reinforcing these levels as key areas of interest for traders.
👉Next Potential Moves
XRP’s price has been relatively stable within the identified ranges. The consolidation is occurring on lower volatility compared with previous swings. This pattern suggests that the market is absorbing supply and demand before a decisive move. Small fluctuations within the range indicate active trading, but no decisive trend has yet formed.
ChartNerd’s analysis emphasizes the buildup of liquidity pressure, noting that volatility is expected once these levels are tested. A breakout above $1.95 could challenge higher resistance zones and trigger stop-loss orders clustered above. Conversely, a drop below $1.9 may test lower support levels and force leveraged liquidations.
At the time of his analysis, the asset traded near $1.92. The heatmap provides a visual representation of these critical thresholds, showing how the distribution of positions may influence the upcoming directional movement.
👉Monitoring Critical Zones
Traders should monitor the $1.9-$1.95 range closely. The consolidation, coupled with heavy liquidity concentrations, indicates that a significant move is imminent. XRP remains in a crucial stage of market activity.
The combination of sideways movement, high liquidity, and concentrated leveraged positions suggests that the asset is preparing for a substantial directional move.
🚀🚀🚀 FOLLOW BE_MASTER BUY_SMART 💰💰💰
Appreciate the work. 😍 Thank You. 👍 FOLLOW BeMaster BuySmart 🚀 TO FIND OUT MORE $$$$$ 🤩 BE MASTER BUY SMART 💰🤩
🚀🚀🚀 PLEASE CLICK FOLLOW BE MASTER BUY SMART - Thank You.
