Bitcoin has just recorded one of the largest capitulation events in its history.
On-chain data shows that the market realized roughly $4.5 billion in losses, marking the second-largest realized loss day ever observed for Bitcoin.
Key takeaways:
Bitcoin recorded about $4.5 billion in realized losses, the second-largest event on record.
The losses reflect forced selling and capitulation, not just unrealized drawdowns.
Technically, momentum has cooled into neutral territory, with early signs of stabilization after a sharp selloff.
The spike is visible in net realized profit and loss data, which tracks when coins are sold at a loss versus a profit. Unlike unrealized losses, realized losses represent actual exits — investors selling Bitcoin below their cost basis. These events typically occur during periods of panic, margin pressure, or broad deleveraging.
https://x.com/coinbureau/status/2015711698662133796
What the On-Chain Data Is Telling Us
Large realized loss spikes tend to cluster around moments of extreme stress, when short-term participants are forced out of positions. That appears consistent with this move, where the market absorbed a heavy wave of loss-taking as price fell sharply from the mid-$90,000s into the $80,000s.
The Technical Picture: RSI Cools, MACD Tries to Turn
The second chart (30-minute BTC/USD on Coinbase) shows the selloff phase clearly, followed by a bounce attempt. At the time of the screenshot, Bitcoin was trading around $87,543 after dipping near the $86,000 area.
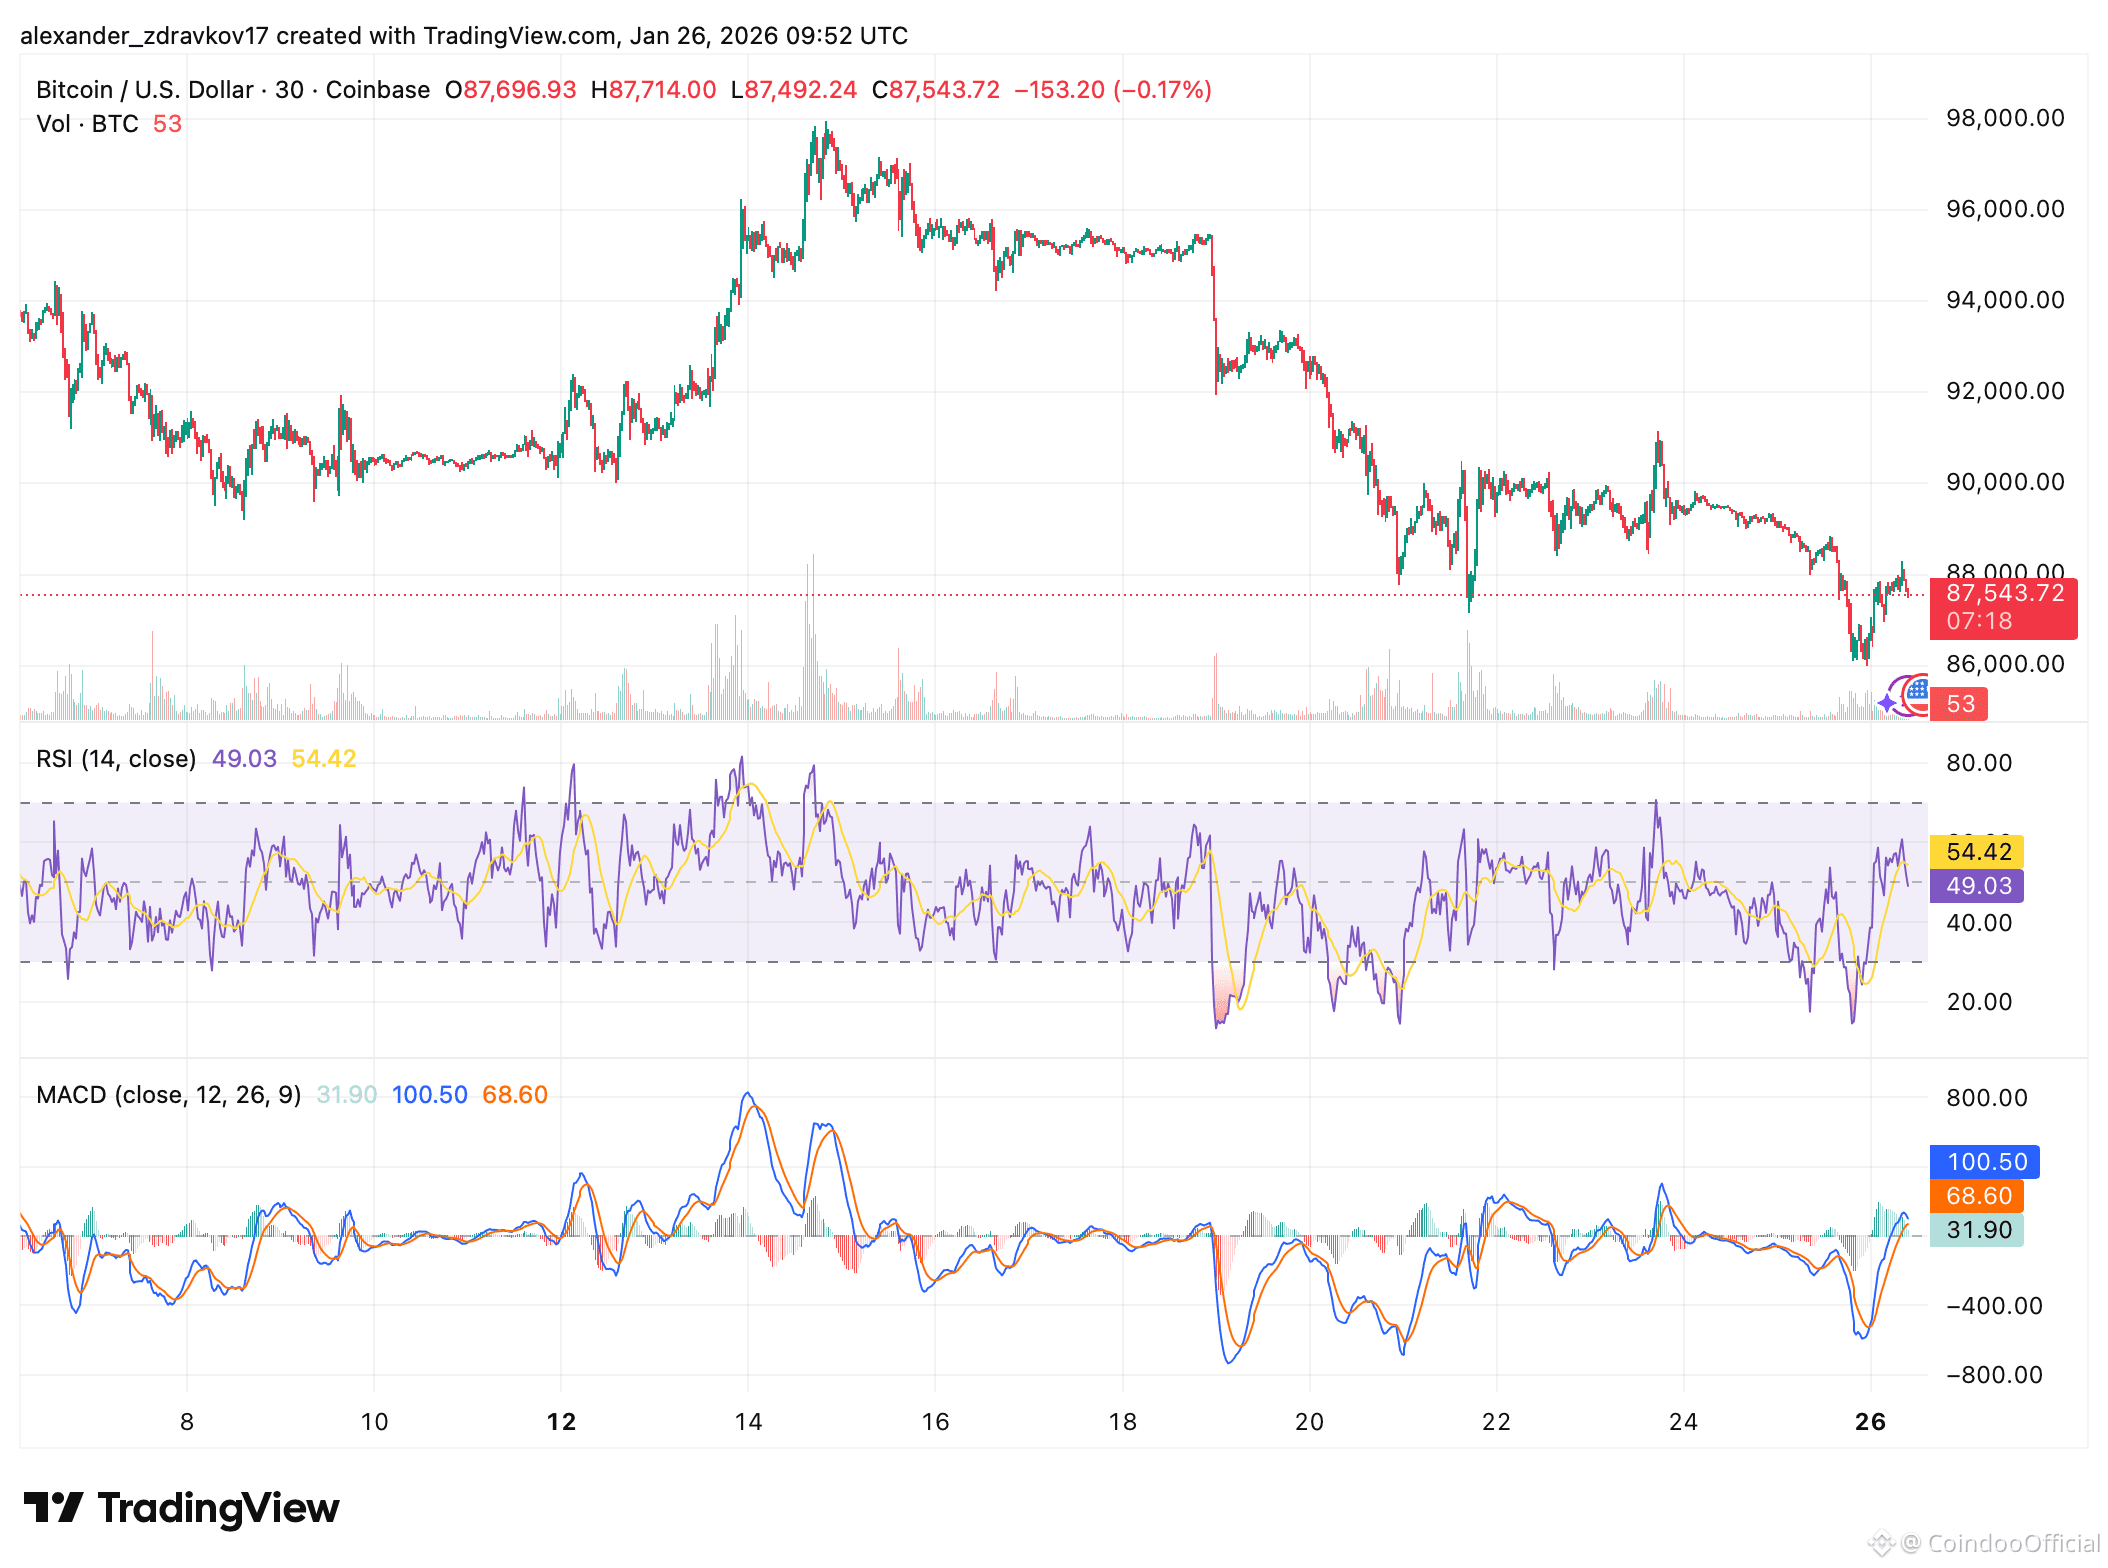
Momentum indicators suggest the market is no longer in pure panic mode, but it hasn’t flipped bullish either:
RSI (14) is sitting around 49.03, which is neutral — not oversold, not overbought. That matters because it shows the dump relieved momentum without immediately triggering a strong oversold snapback. The RSI moving average shown in the chart is around 54.42, which also implies RSI is recovering, but not decisively.
MACD (12, 26, 9) is showing a potential improvement in momentum: the MACD line is above the signal line (100.50 vs 68.60) and the histogram is positive (31.90). In practical terms, that points to a short-term stabilization / bounce impulse, even if the broader structure remains damaged.
Price structure is still the main issue. The chart shows a clear breakdown from the prior range around $94,000–$96,000, followed by a steep leg down and choppy consolidation near $86,000–$88,000. For bulls, reclaiming the low-$90,000s zone would be a key step toward restoring trend control. For bears, failure to hold the high-$80,000s keeps the door open to another volatility leg.
Why Capitulation Events Matter
While painful in real time, large realized-loss events often act as a market reset — washing out leveraged positioning and transferring coins from weaker hands to stronger ones. That doesn’t guarantee an immediate reversal, but when you combine a historic realized-loss spike with momentum indicators drifting back toward neutral, it often signals that the most aggressive forced selling may be fading.
The near-term outlook now depends on whether Bitcoin can build a base above the recent lows — and whether the market can reclaim key resistance levels without triggering another liquidation cascade.
