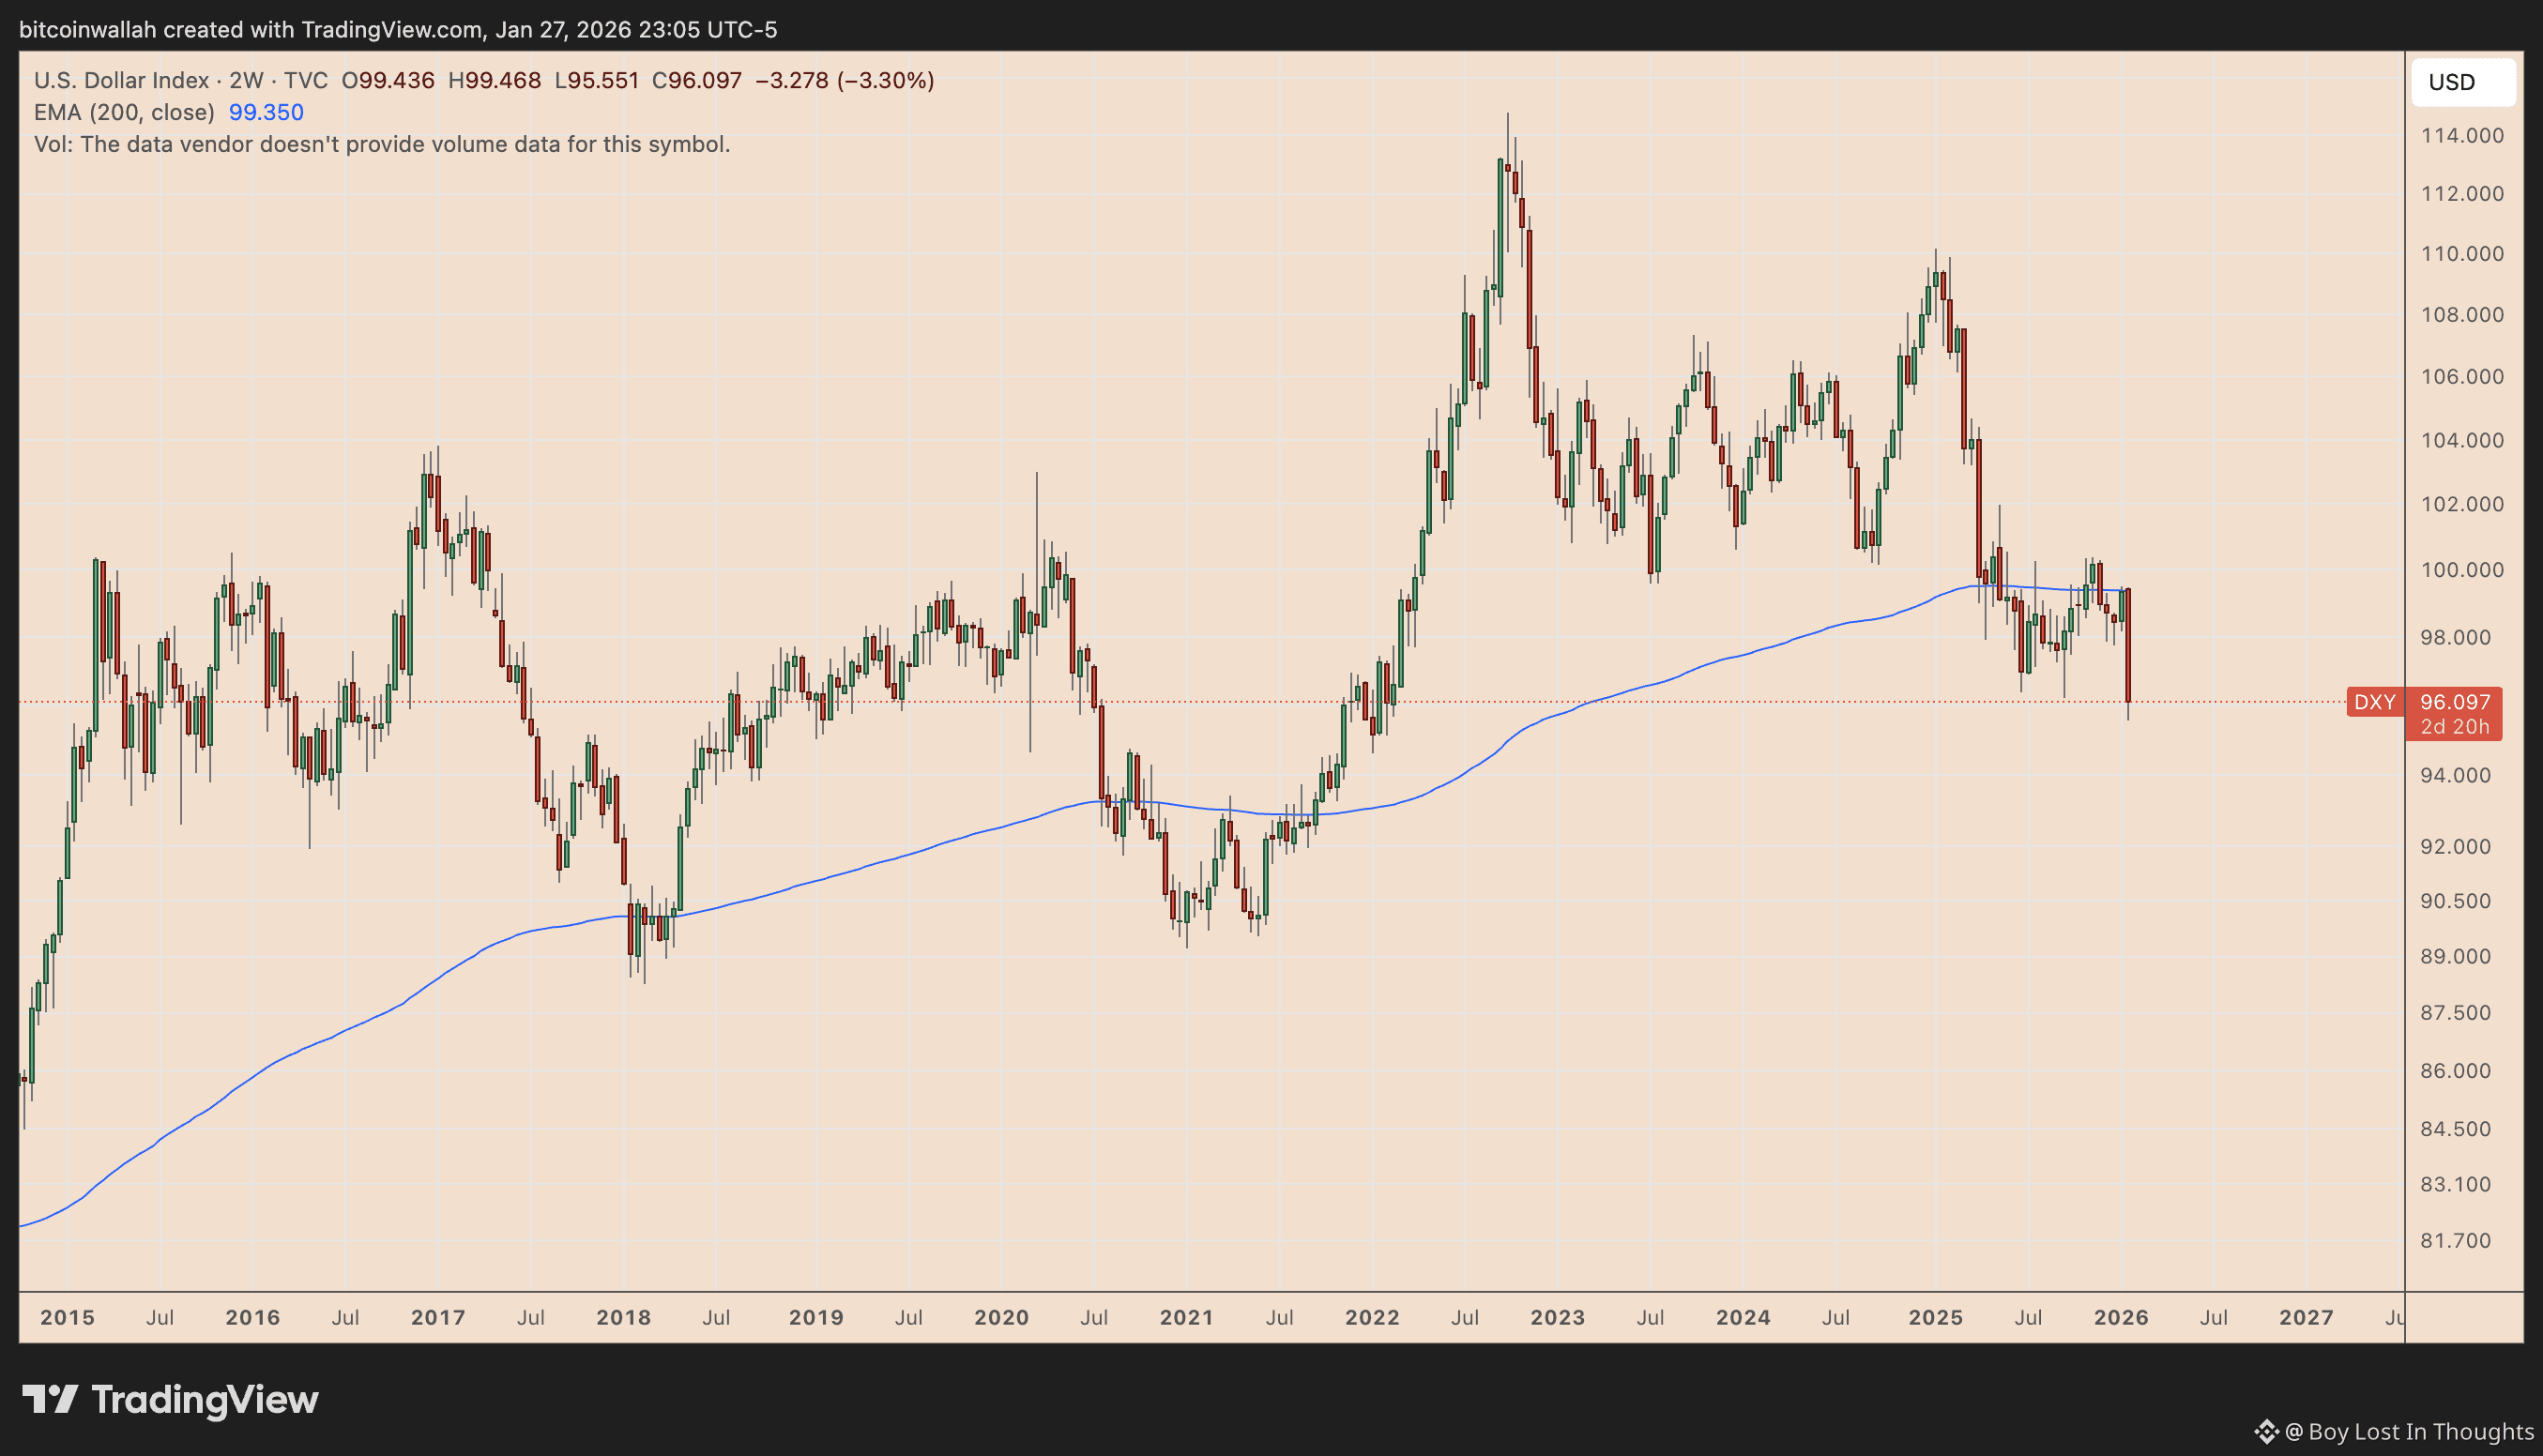
Bitcoin analysts are closely monitoring a critical juncture for the US Dollar Index (DXY), currently trading near 96.3. Historically, the DXY breaking below the 96 level has acted as a major launchpad for Bitcoin, preceding its massive bull runs in 2017 and 2020 (a 540% surge).
However, the current market environment presents new challenges. Unlike the previous cycles of near-zero interest rates and heavy stimulus, today's landscape features higher rates, higher real yields, and risks like a potential yen carry trade unwind. These factors could create headwinds for risk assets like Bitcoin.
Despite the tougher macro backdrop, catalysts such as Bitcoin ETF inflows and potential Federal Reserve policy easing could fuel a significant rally. Some forecasts suggest this could propel Bitcoin toward $150,000 in 2026, especially if the historical "dollar fractal" pattern repeats.
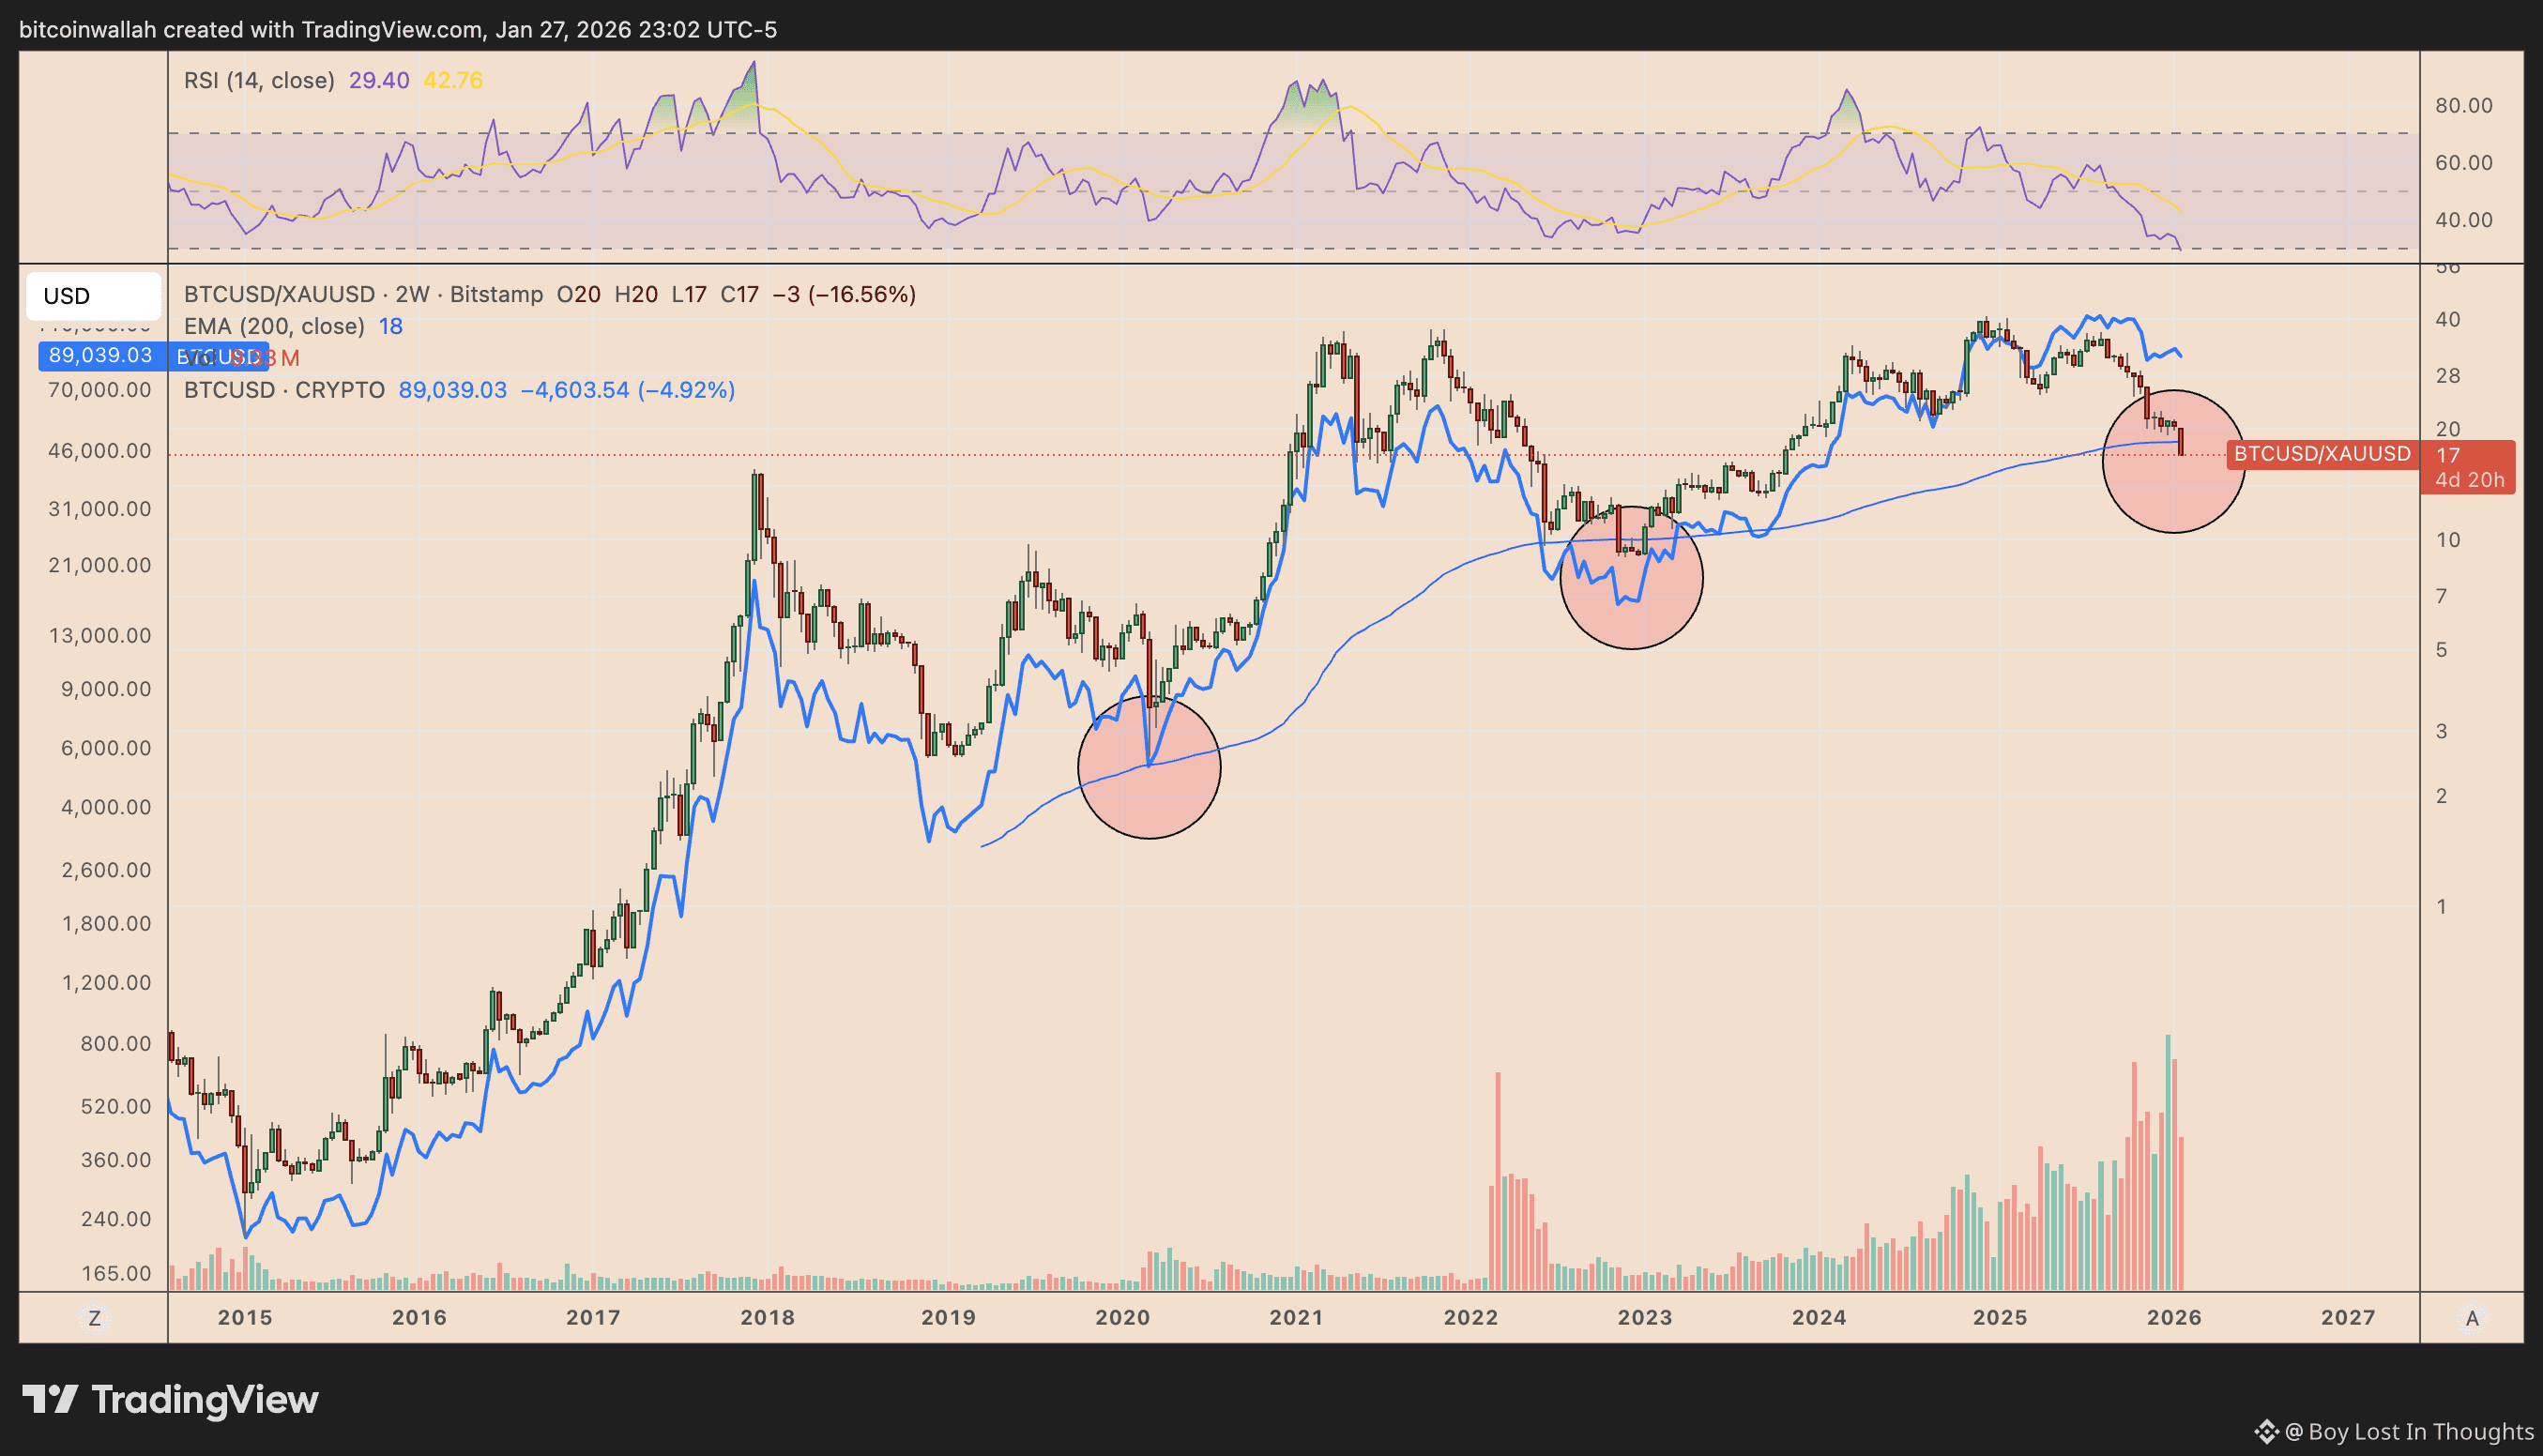
Adding to the bullish case, Bitcoin is also approaching a key long-term cycle benchmark against gold (the BTC/XAU 200-week moving average), a level that has historically coincided with major trend resets before new price expansions.
Key Points Highlighted:
Historical Signal: The US Dollar Index (DXY) is nearing 96, a level whose breakdown preceded Bitcoin's historic bull runs in 2017 and 2020.
Major Contrast: The current macro setup is tougher than in past cycles, with higher interest rates and real yields, posing potential risk-off scenarios.
Bullish Catalysts: Bitcoin ETF demand and potential Fed easing could override macro headwinds and drive the next rally.
Price Target: A replay of the fractal pattern could fuel a run toward $150,000 for Bitcoin in 2026.
Additional Confirmations: Bitcoin's price measured in gold (BTC/XAU) is nearing a key long-term moving average, a level that has historically marked cycle "resets" before major advances.