📊 $BNB Weekly Chart Structure
From what we see:
BNB broke weekly structure lower.
Price dropped from ~$1300 ATH down to the $600 area.
EMAs (7, 25, 99) are giving bearish alignment:
EMA7 < EMA25 < EMA99
StochRSI is super low (oversold).
This is the classic bearish trend with oversold signals.
📉 What This Suggests (Technical Interpretation)
1️⃣ Short-Term (Next few weeks)
Price is still in downtrend
Oversold could trigger relief bounce
But until we break structure above EMA25 weekly, it’s still bearish
👉 Means: Expect choppy action + possible bounce
2️⃣ Medium / Long-Term
Altcoins tend to bottom after BTC consolidates.
BTC near $64k → not confirmed bull yet.
So BNB likely follows BTC:
⚠️ If BTC breaks down below major support → alts can drop more
📌 Important Rule in Crypto
Altcoins do not bottom first — BTC must bottom first.
Only after BTC shows confirmed reversal do alts usually rally.
📉 Historical Down From ATH
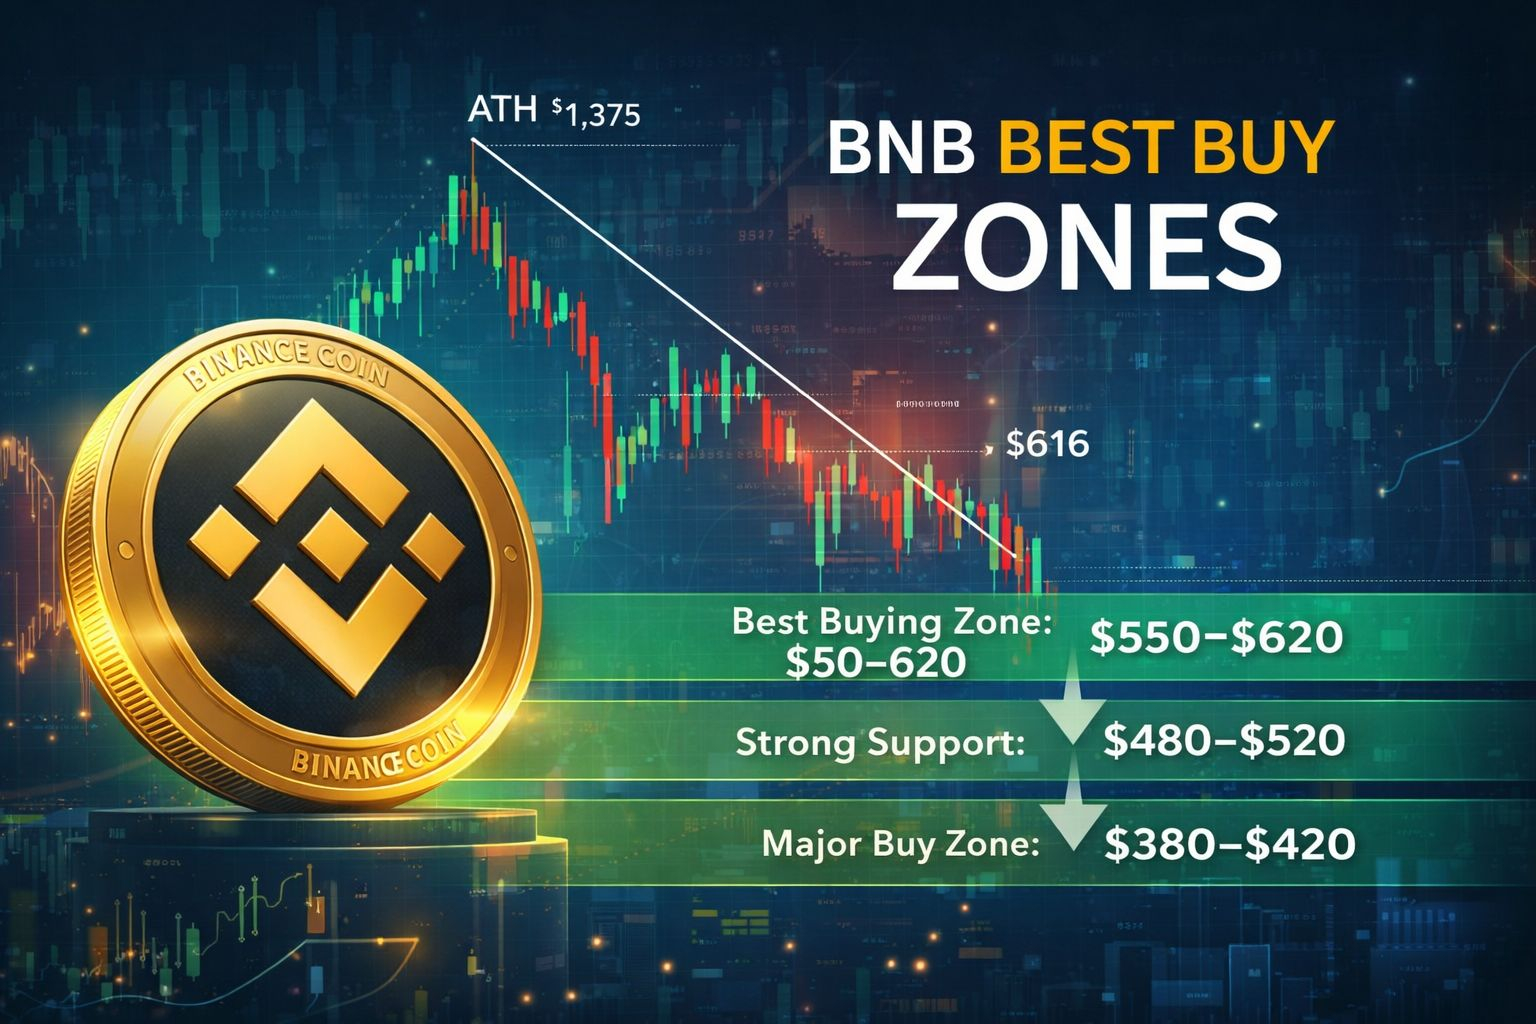
BNB ATH: ~$1,375
Current ~ $610–620
Drop: ~ 55–56% from ATH
So BNB has already retraced significantly.
📍 Key Support & Buy Zones (Long-Term)
Let’s identify support areas based on structure, volume, and historical levels.
🔵 Support Zone #1 — $550–620
Current region
Psychological support
Area with some past consolidation
This is first major support.
🟡 Support Zone #2 — $480–520
Below current price
Potential reaction zone
Volume clusters previously
This is secondary support if price weakens.
🔴 Strong Support / Low Risk Zone — $380–420
Third zone if market deteriorates
Historical reaction area
Strong demand likely
Not likely if BTC stabilizes, but possible in deeper correction.
Summary of BNB Buy Zones
Zone Purpose
$550 – $620 Near-term support — first buy zone
$480 – $520 Stronger support — dip buy
$380 – $420 Deep correction risk zone — major accumulation
📈 What If Market Drops Further?
If BTC breaks critical support below ~61k–62k:
Then:
➡️ BNB could retest $480–520 Or even: ➡️ $380–420 if BTC drops significantly
Not guaranteed — but risk increases if BTC structure fails.
📊 What If Market Stabilizes / Reverses
Signal for trend change:
BNB needs to break above:
✔️ Weekly EMA25 (~around $860 zone)
✔️ Price reclaiming $900+
✔️ Higher weekly highs
Only after these occur can we say: 📌 BNB is shifting from bearish to bullish trend.
🧠 Long-Term Perspective (Bear > Bull Cycle)
Altcoins historically behave like this:
📍 Phase 1: BTC trend weak → alts drop deeper
📍 Phase 2: BTC finds bottom → alts consolidate
📍 Phase 3: BTC breaks trend → alts begin rally
📍 Phase 4: Bull market → big alt gains
Right now, we are likely in Phase 1 or 2, not 3 or 4.
So ideally you accumulate in zones, not at one price.
📌 Expert Buying Strategy (Without Emotion)
Instead of one buy price, use layered accumulation (DCA):
💠 1st Buy: $600–620
💠 2nd Buy: $550–580
💠 3rd Buy: $480–520
💠 4th Buy (if heavy BTC drop): $380–420
This protects you and improves average cost.
🛡️ Risk Control Rules
📌 Always check BTC trend first
📌 No all-in at one level
📌 Buy on strength within zones, not on breakdowns
📌 Add on green candles in these zones
📊 Effect of BTC Downtrend on BNB
Since BTC ~ $64k still weak:
➡️ BNB likely to continue choppy to downward pressure
➡️ Full trend reversal only after BTC stabilizes
But the good news:
BNB is already closer to support than to previous highs.
🧠 What This Means for Your BNB Holding
1. Lower downside exists — yes
2. But major drop probability reduces near $480–520
3. Near $380–420 becomes high-probability long-term buy zone
4. If BTC turns bullish first, BNB will outperform
📌 Final Answer (Clear & Practical)
Short-Term:
⚠️ Still bearish until confirmation
Possible bounce
Support Zones:
🔹 $550–620 — first support
🔹 $480–520 — strong support
🔹 $380–420 — major accumulation zone
Best Long-Term Buying Approach
✔️ Layer buys inside these zones
✔️ Watch BTC trend — if BTC bottoms → BNB starts rally early
✔️ Avoid buying near resistance (e.g., $800–900) in downtrend

#RiskAssetsMarketShock #MarketCorrection #WhenWillBTCRebound #ADPDataDisappoints #BitcoinDropMarketImpact