$US Recently, U.S. software and data stocks suffered a steep sell-off, losing about $1 trillion in market value amid investor fears over AI disruption — part of a broader market correction pressure. �
Reuters
Major indices also slid:
Dow Jones fell ~600+ points.
S&P 500 dropped ~1.2% and turned negative for 2026.
Nasdaq slid harder due to tech pressures. �
New York Post
🌍 • Global Markets React
Australian markets (ASX) saw a 2%+ plunge, wiping out ~$55 billion AUD in value as global sell-offs spread. �
News.com.au
Volatility spiked in stocks, commodities, and crypto as investors rotated into defensive assets. �
MarketWatchWhat Market Correction Means
A market correction is typically defined as a 10%+ decline from a recent peak in major stock indices — a pullback from highs that doesn’t yet constitute a full bear market. �
Recent moves (especially in tech and broader stock indices) suggest markets are digesting high valuations and shifting sentiment, potentially signaling a correction phase.
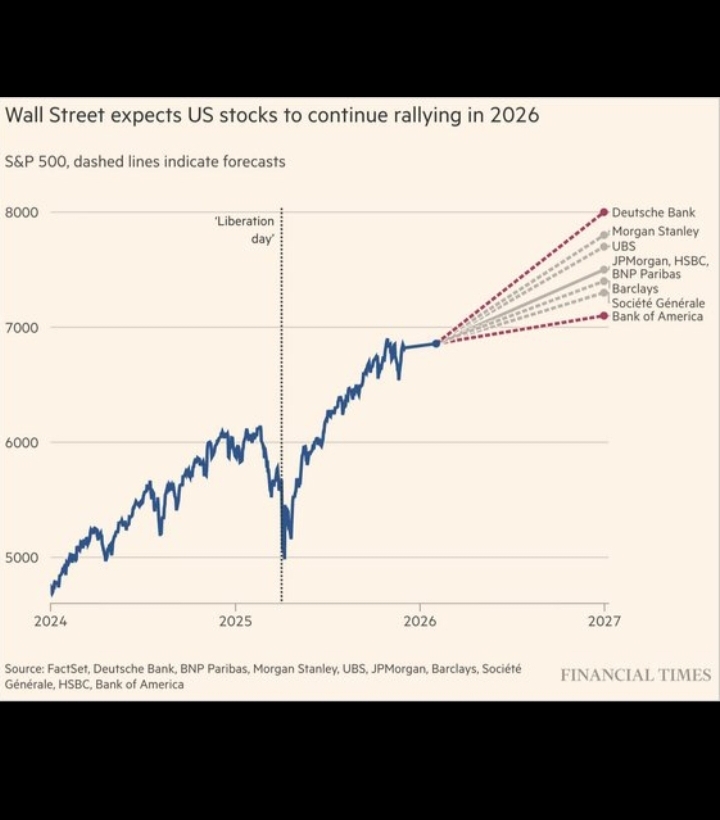
📷 Market Chart Snapshot
Below is an example of what correction-level movements look like — often shown in financial media as a drop from recent highs to lower index levels:
�Example: S&P 500 drawdown from peak (illustrative)#RiskAssetsMarketShock #WhenWillBTCRebound #WarshFedPolicyOutlook #ADPDataDisappoints