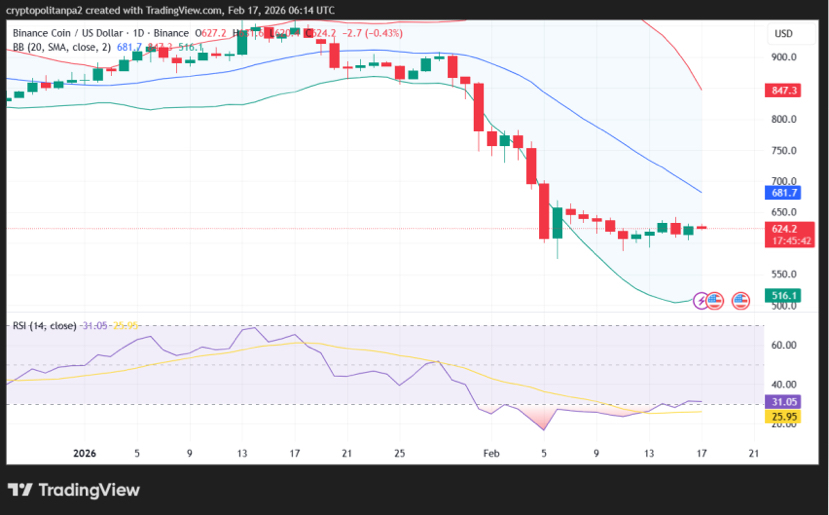
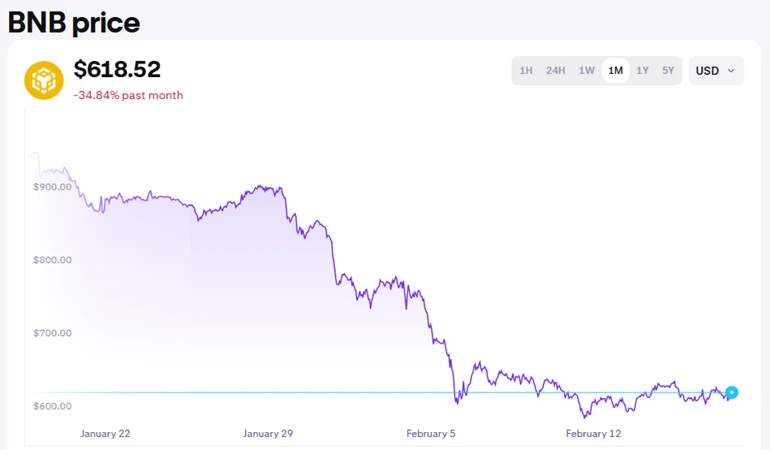
BNB (Binance Coin) has experienced significant volatility in early 2026, marked by a sharp downtrend from highs around $920 in late January to current levels near $615-$625. This represents a roughly 34% decline over the past month, driven by broader market sell-offs, regulatory pressures on Binance (including Iran transaction allegations), and bearish momentum in the crypto sector. As of February 18, 2026, technical indicators predominantly signal a “Strong Sell” on daily timeframes, with all major moving averages pointing downward. However, oversold conditions and emerging divergences suggest potential for a short-term rebound if key supports hold.
Price Action and Trends
• Short-Term Trend: BNB is in a clear downtrend, with price action forming lower highs and lows since early February. It recently tested lows around $570 on February 6 before a mild recovery, but has resumed declines, trading in a consolidation range between $600-$650.   On the 1-hour chart, price is below the VWAP ($655) and key EMAs (EMA336 at $649, EMA168 at $626), confirming bearish bias. 
• Medium-Term Trend: The weekly chart shows BNB revisiting 2025 highs ($697-$674), now acting as resistance. The asset is in a deep correction phase, with ADX at 39 indicating strong trend strength (bearish).   Overall, the trend score is -66, signaling sustained pressure. 
• Long-Term Trend: Despite the pullback, BNB remains above major 2025 supports like $508-$518. Historical patterns suggest this could be a retest of breakout zones from 2025, potentially setting up for recovery if broader crypto sentiment improves.
Key Support and Resistance Levels
• Supports: Immediate support at $600-$630 (psychological and historical breakout zone), followed by $587-$594, $570 (recent low), and $550 (next psychological level).    Deeper levels include $508-$518 (2025 lows) and $645-$603 (multi-month support cluster). 
• Resistances: First hurdle at $626 (EMA168), then $630-$642 (pivot high and upper triangle boundary), $650-$660, and $697-$700 (2025 highs).   A break above $700 could target $730-$750.  
Technical Indicators
• Moving Averages: Strong sell signals across the board. Simple and exponential MAs (5, 10, 20, 50, 100, 200) all indicate downward momentum. Price is below all key MAs, with no buy signals.  Mild bullish crossovers on shorter MAs suggest potential short-term rebound. 
• RSI (14): Daily RSI at 24-26 (oversold below 30), indicating extreme selling pressure but potential exhaustion.   On 1H, RSI at 54 (neutral), showing consolidation without strong directional bias.  Oversold without reversal on higher timeframes. 
• MACD: Red histograms on daily, confirming bearish momentum. However, EMA alignment and MACD structure on 12H/4H show cautious bullish potential.   Bullish divergences noted on Stochastic (12H), where lower price lows aren’t matched by indicator lows. 
• Bollinger Bands/Other: Price is in the lower half of recent ranges, with low relative volume (0.39) indicating weak conviction.  Supertrend is in sell mode. 
Chart Patterns
• Symmetrical Triangle: Forming on daily/4H charts, with price approaching apex. Breakout above upper trendline ($630-$642) could lead to bullish expansion toward $650-$720; breakdown below support ($600) risks $550-$570.  
• Double Top: Observed on 4H in mid-January around $920, leading to breakdown.  However, larger timeframe shows consolidation above demand zones ($850-$880 earlier, now lower). 
• Pennant/Flag: Bearish pennant on daily, signaling potential deeper correction if not reversed. 
• Order Blocks: High-probability buy zone at $826-$843 (earlier defense point), but current action is below this.
Market Sentiment and Outlook
Sentiment is mixed but leans bearish due to regulatory overhang and derivatives data showing bearish positioning.   Oversold technicals (RSI, divergences) hint at a relief rally, potentially to $650-$680 if $600 holds.   Longer-term, analysts forecast recovery to $950-$1,050 by late February or $1,400 amid token burns and ecosystem upgrades (e.g., opBNB hard fork targeting 20,000 TPS).   Risk of further downside to $550 if supports break, especially in sync with BTC weakness.  Monitor volume for confirmation—low anomaly suggests indecision.
#BTC走势分析 #StrategyBTCPurchase #BTCVSGOLD #BitcoinDunyamiz #BTC100kNext?