
Large-Scale XRP Withdrawals Hit $82 Million as Exchange Reserves Plunge
$XRP has emerged as a standout performer with 7% weekly gains, trailing only Dogecoin among top cryptocurrencies. Behind this seemingly positive price action lies a complex tug-of-war between conflicting technical signals that could determine whether XRP repeats its January surge or suffers a significant pullback.
Bearish Pattern Emerges on Shorter Timeframe
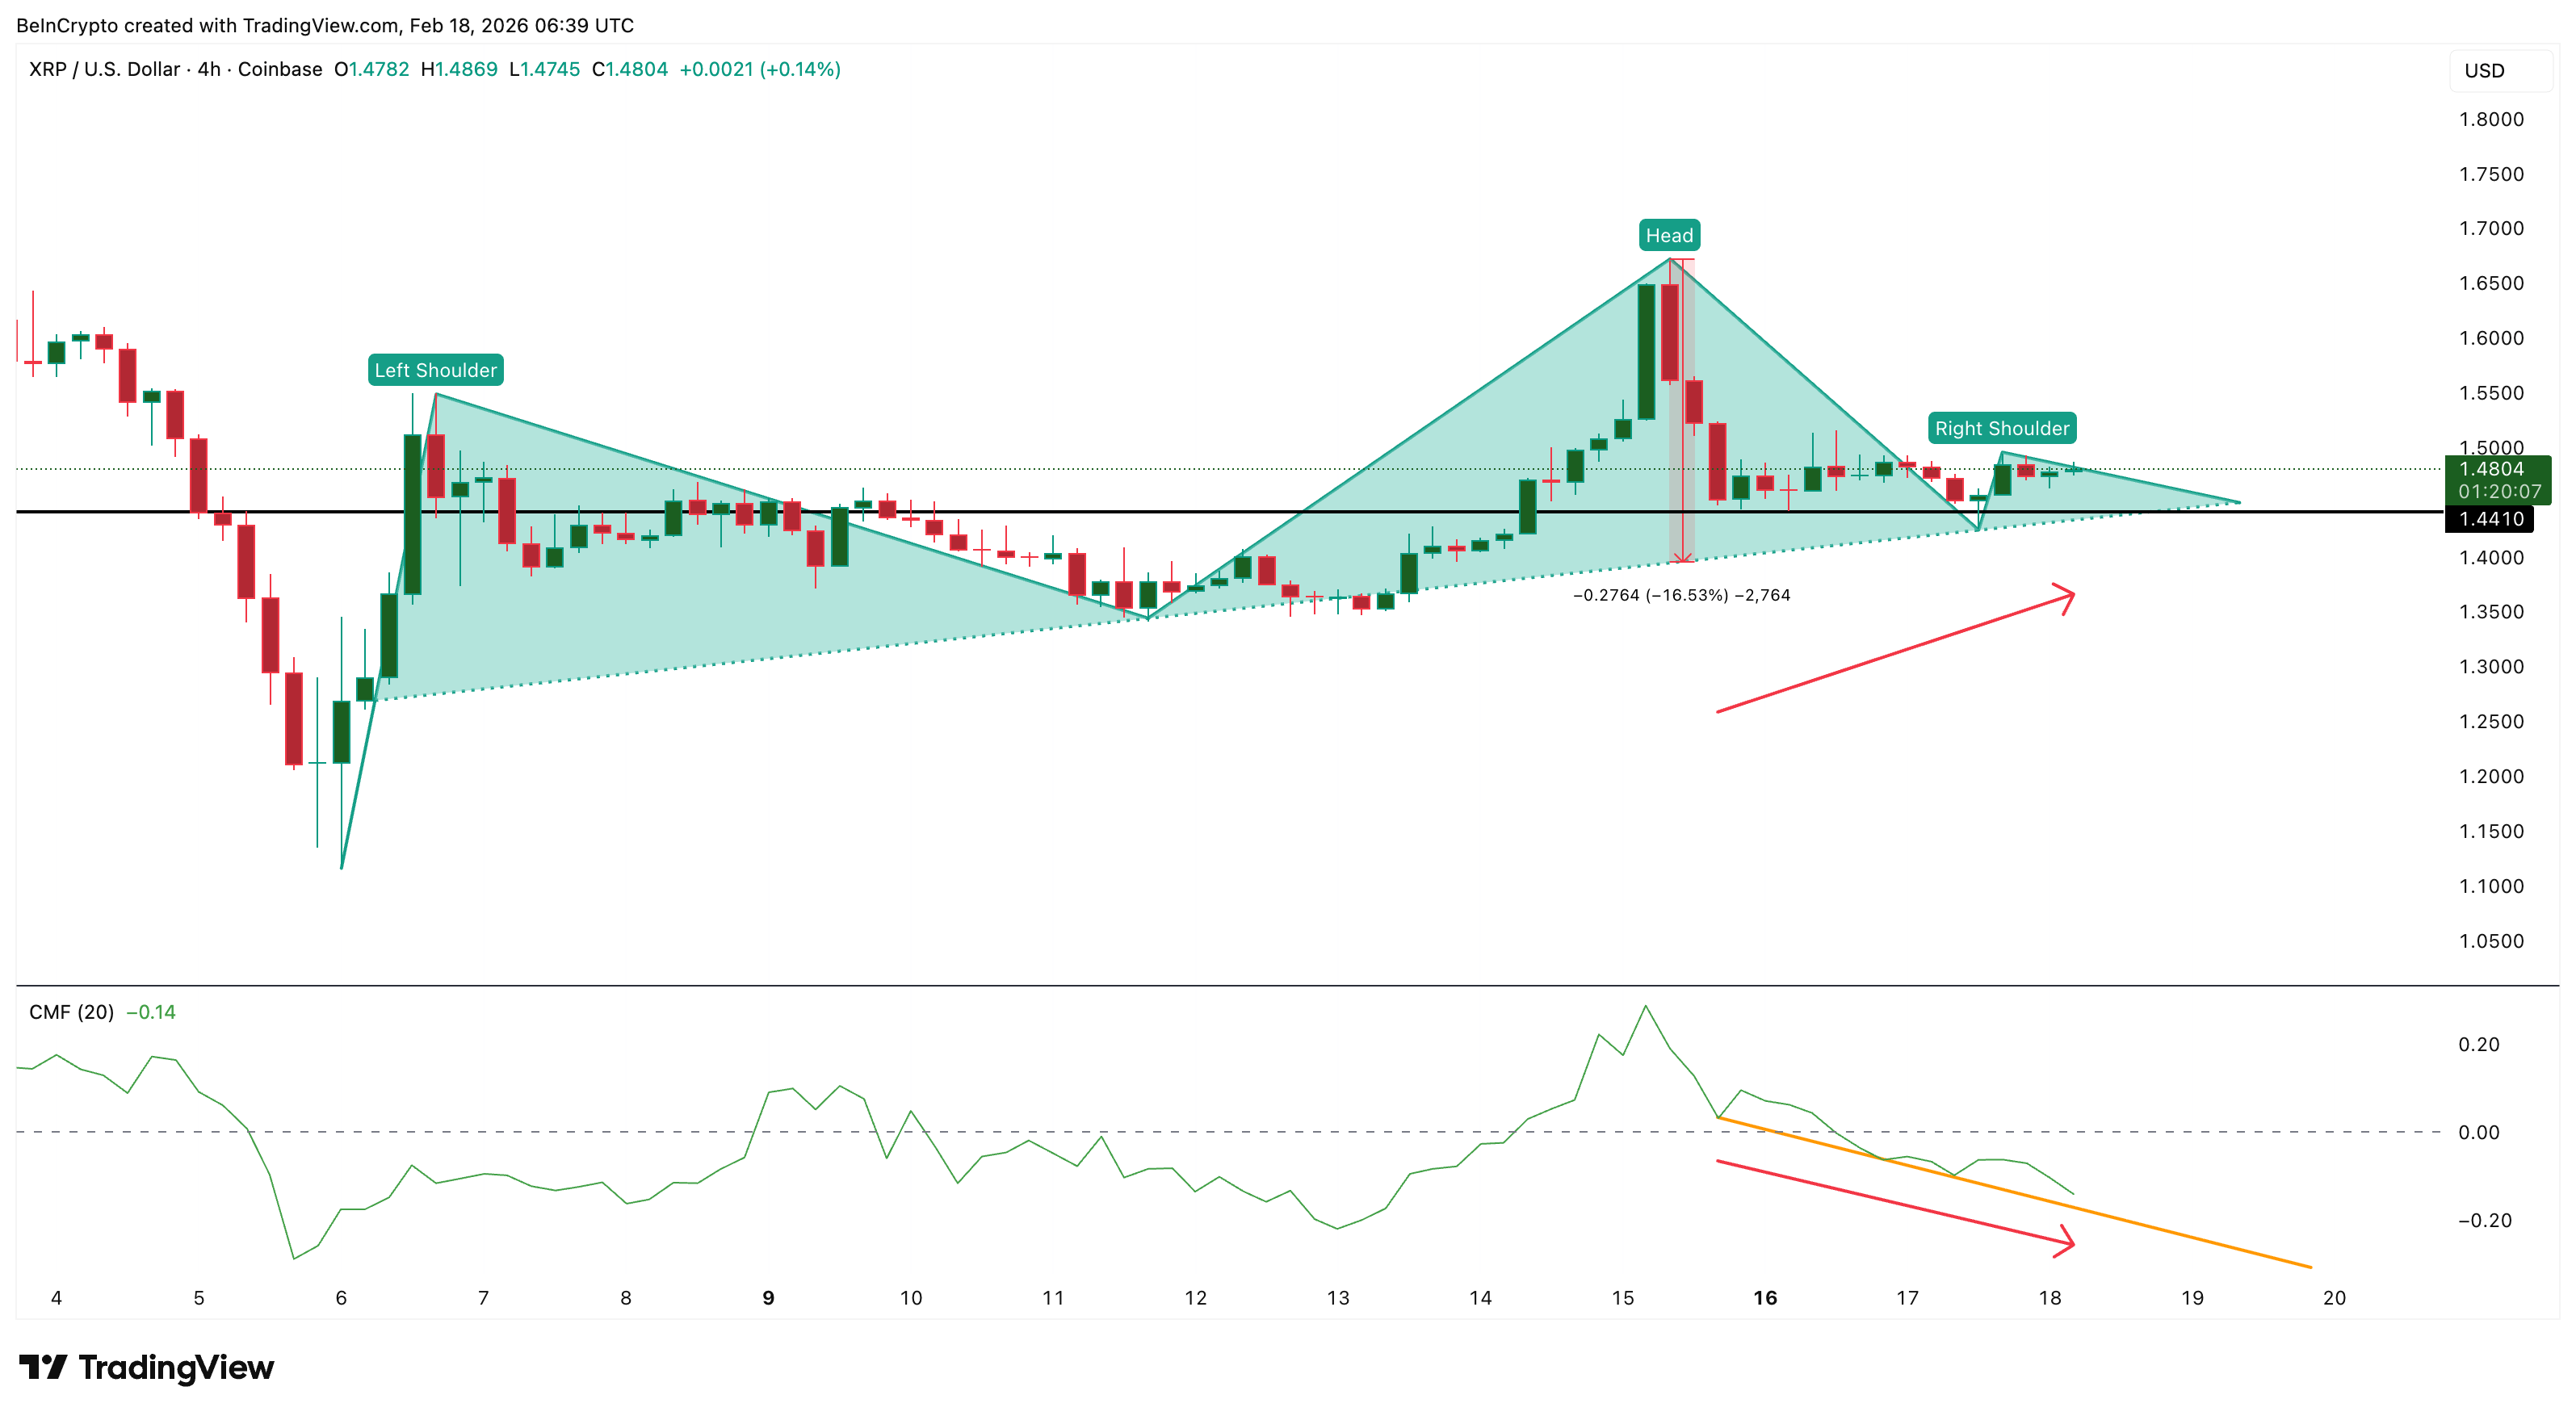
The four-hour chart reveals a concerning head and shoulders formation with its neckline positioned near $1.44. This classic reversal pattern suggests potential downside risk of approximately 16% if support levels fail. Since February 17, XRP has traded sideways as buyers attempt to invalidate the bearish structure.
Adding to the cautionary signals, the Chaikin Money Flow indicator has been diverging negatively since mid-February. While XRP prices attempted recovery, this volume-based metric trended downward and ultimately breached the zero threshold. This divergence typically indicates that institutional participants may be distributing coins during price bounces, a behavior often preceding trend reversals.
Whale Activity Tells Different Story
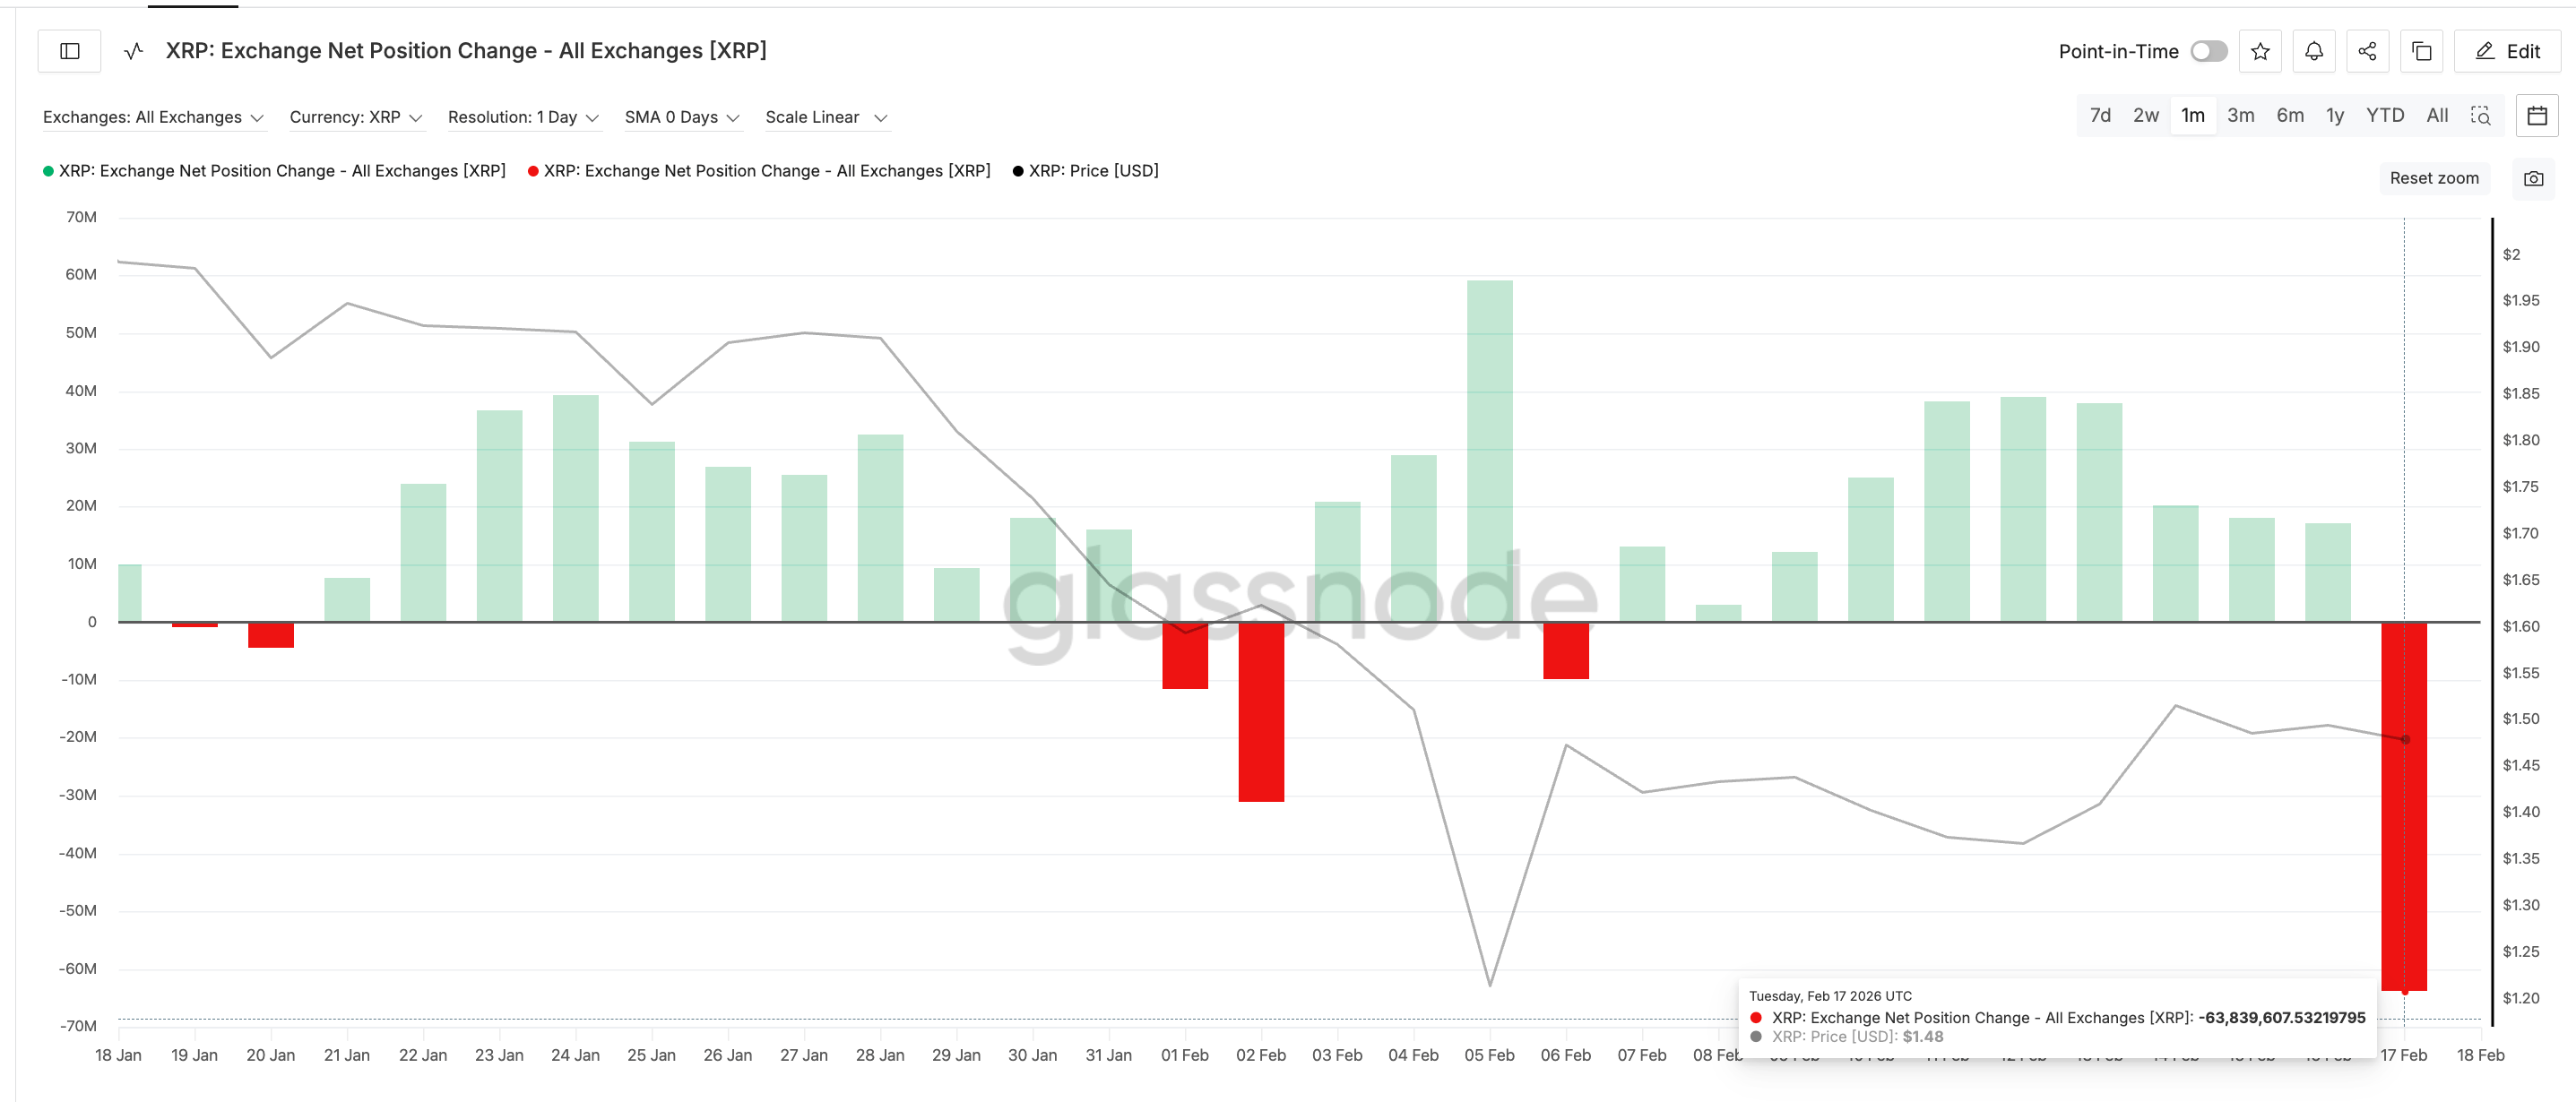
Despite the bearish short-term pattern, on-chain data reveals aggressive accumulation from sophisticated market participants. Exchange net position change flipped dramatically on February 17, showing approximately 63.8 million XRP leaving trading platforms—the largest single-day outflow in weeks. At current valuations, this represents roughly $92 million in tokens moving to private wallets.
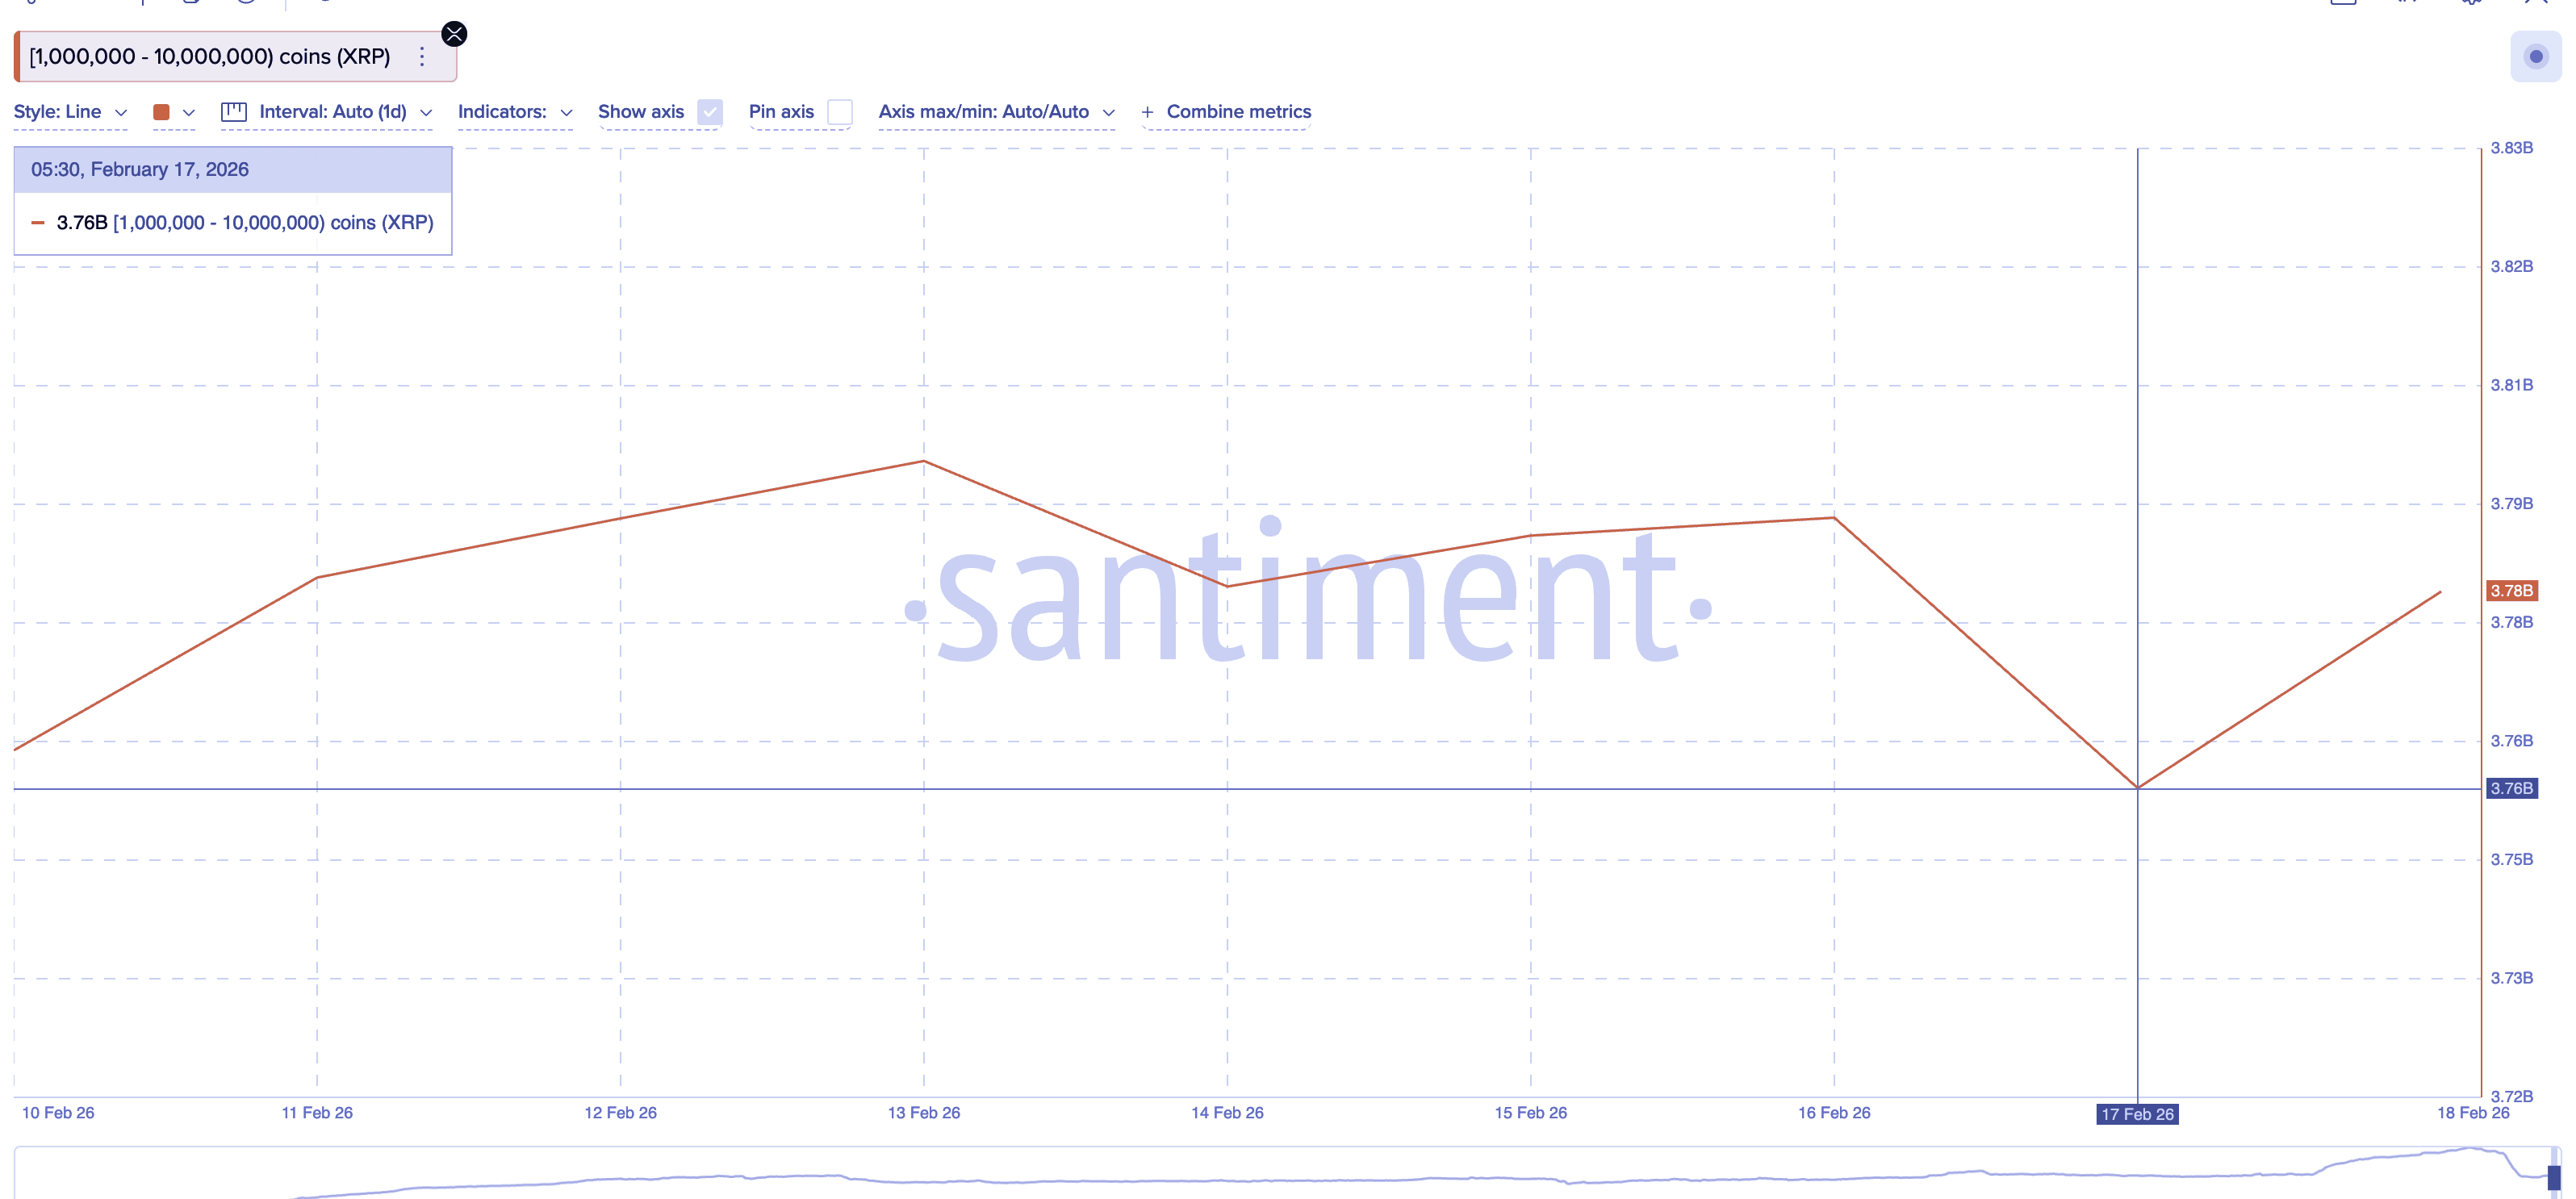
Addresses holding between 1 million and 10 million XRP have been particularly active, adding roughly 20 million coins to their combined holdings since February 17. This whale cohort now controls approximately 3.78 billion XRP, representing strategic accumulation rather than random retail purchasing.
Smart Money Indicator Repeats January Pattern
The daily chart's Smart Money Index delivered a significant crossover signal on February 15, moving above its signal line for the first time since January 1. The previous occurrence of this signal preceded a 30% rally that materialized within weeks.
This longer-term indicator often captures positioning from experienced traders who accumulate during periods of retail uncertainty. The current signal suggests that despite short-term bearish patterns, sophisticated capital is positioning for upside.
$1.42 Level Becomes Critical Decision Point
The convergence of these opposing forces makes the $1.42-$1.44 zone particularly significant. A sustained breakdown below this neckline could trigger the head and shoulders pattern's measured move, potentially targeting lower levels near $1.20.
However, the substantial exchange outflows combined with whale accumulation and the bullish Smart Money signal create a compelling case for eventual upside. The 4-hour bearish pattern may simply represent short-term profit-taking following recent gains, while larger players accumulate for a broader move.
Traders now watch whether the bullish daily signals can overwhelm the bearish intraday structure, with XRP's direction likely determined by which timeframe ultimately asserts dominance in coming sessions.