The current situation in the Bitcoin $BTC market presents a complex picture where short-term reactions and technical indicators are showing some positive aspects despite the long-term pressure. It is important for investors to adopt a cautious strategy by considering different timeframes and technical indicators.
The long-term trend of the market is clearly downward, as judged by the 365-day and 90-day expansion downtrend. The prices have fallen by about 30% in the last few months, due to which the market is dominated by a bearish trend. The HMA indicators also confirm that the direction of the 50-day, 100-day and 200-day moving averages is downward, indicating a strong downtrend. However, the 50-day HMA is continuously moving down despite the price being below, which indicates a bearish rule in the medium term as well.
In the short term, the RSI and MFI figures are below 30, which is a sign of a weak market, but they have not reached the oversold zone (below 20), so there is no strong selling in the market at the moment. The price staying inside the Bollinger Bands and being close to the middle line indicates the uncertainty of the market. According to the 1-day daily expected levels, both the RSI and Bollinger are oversold prices between approximately 60683 and 61606, which is lower than the current price of 66412, so the market is not yet in the oversold zone but is close to it. In this sense, the possibility of a short-term rebound is medium.
At intraday levels, the 1-hour and 4-hour RSI indicators are also near 34 and are sloping downwards, indicating short-term pressure. Similarly, the position of the Bollinger Bands is also close to the lower part of the price, indicating a potential support zone. Support levels between 65596 and 66274 look strong, if broken, the next major support is between 62302 and 63339, which could lead to further declines. Resistance levels between 67620 and 68693, from where the price is likely to stop.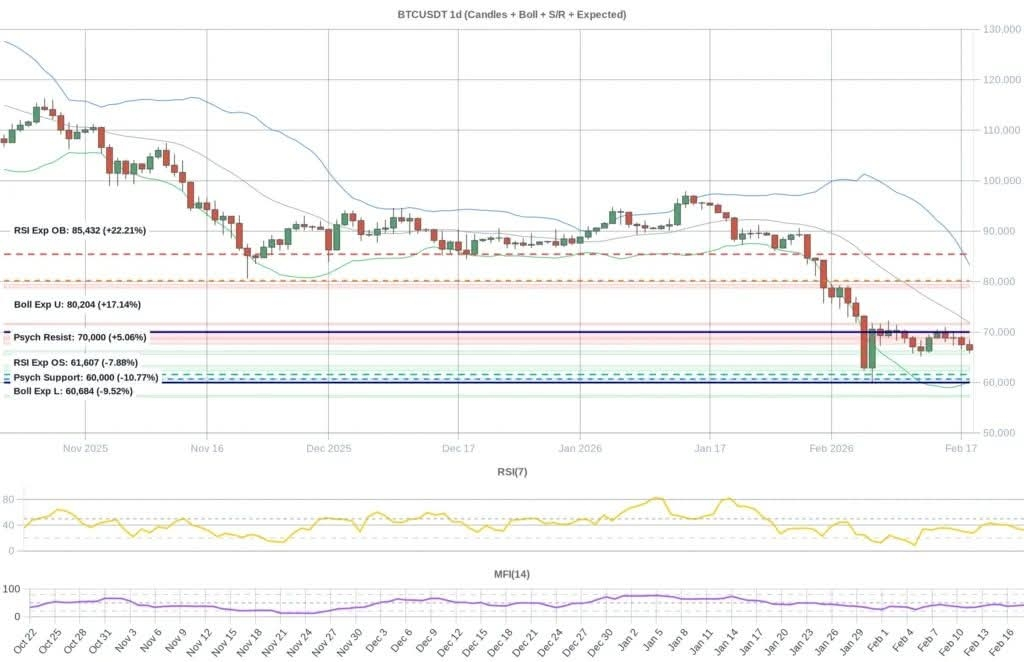
The intensity of fear is still prominent in the market sentiment, as the Fair and Grade Index is between 8 and 12, which is close to extreme fear. Such an environment usually provides a buying opportunity for large investors, especially when the price is close to the oversold zone. The funding rate is positive but very low, indicating some degree of balance in the market, while open interest has increased by 4.4%, which is a sign of increasing interest in the market. The news of the past five days has also been generally bearish, especially due to global monetary policies and US President Trump’s economic strategies, which have created uncertainty in the market.
Overall, the #Bitcoin market is going through a complex phase where short-term technical indicators and support levels offer some hope for stability despite long-term pressure. Investors should carefully observe the different timeframes and technical indicators of the market and avoid emotional decisions. If the price remains stable at support levels, a short-term rebound is possible, but the long-term bearish trend still prevails, so it is important to be cautious.