1. Moving Average Convergence
The chart shows the MA(7), MA(25), and MA(99) converging closely around the $1,950 level. This "cluster" often signals a period of indecision or consolidation. The price is currently fighting to stay above the MA(99) ($1,952.96), which is acting as immediate resistance.
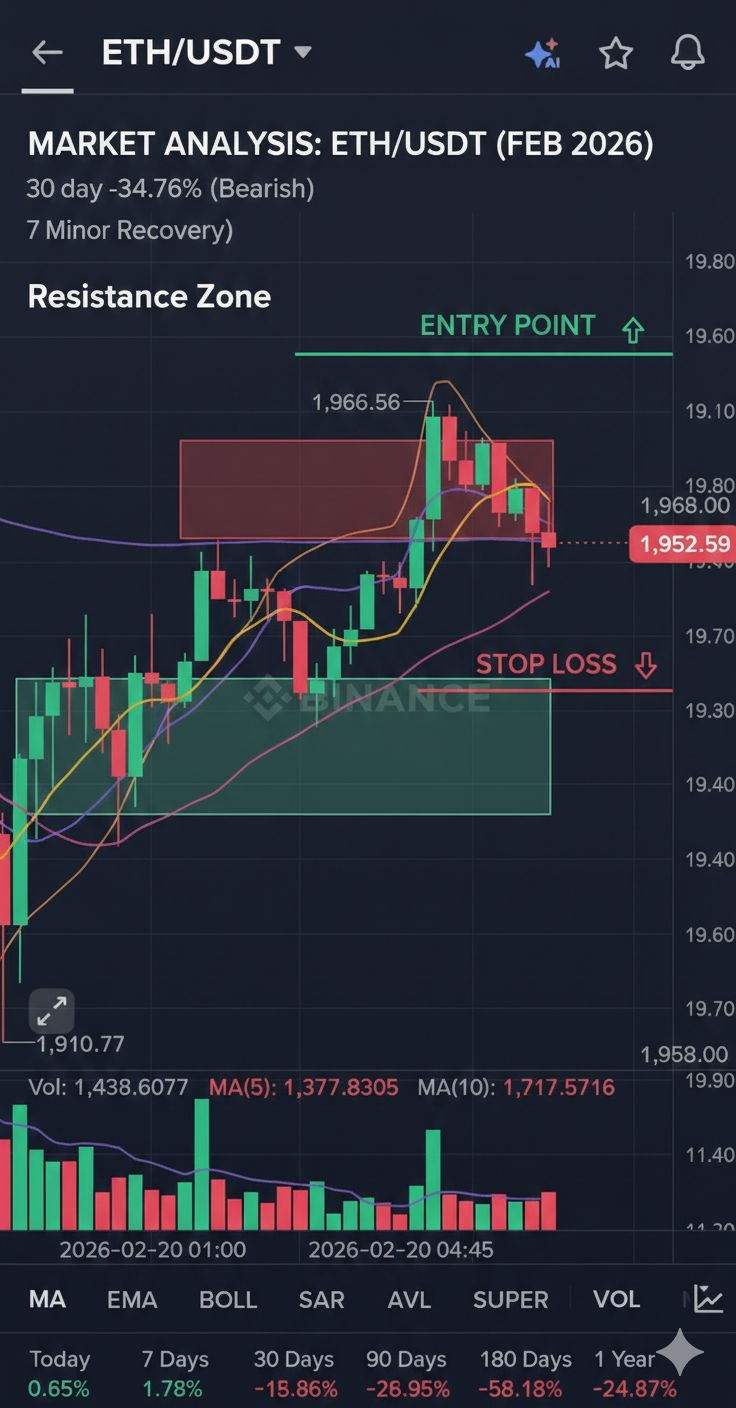
2. Bearish Long-Term Sentiment
While the 7-day trend shows a minor recovery of +1.78%, the longer-term metrics are concerning:
30-Day Change: -34.76%
180-Day Change: -58.93%
These figures suggest that despite short-term bounces, the overall market remains firmly in a "sell on strength" phase.
3. Support and Resistance Zones
Immediate Resistance: $1,964.54 (recent local high).
Immediate Support: $1,910.77 (24h low area).
The low trading volume at the most recent candles suggests a lack of buying momentum to push past the $1,960 mark.
Summary Trend
The market is currently Neutral-to-Bearish. Without a significant spike in volume to break above the MA cluster, Ethereum likely remains range-bound between $1,910 and $1,965.