🧠 Introduction
Many traders prefer Line Charts because they remove noise and focus only on closing prices. This makes it easier to identify key Support and Resistance levels clearly.
🔹 What is a Line Chart?
A line chart connects closing prices over a selected timeframe.
Unlike candlestick charts, it does not show wicks or intraday volatility — just the market’s final decision (closing price).
Example assets traders analyze:
Bitcoin (BTC)
Ethereum (ETH)
BNB (BNB)
🔹 How to Identify Support on a Line Chart
📌 Step 1: Switch chart type to Line
📌 Step 2: Look for areas where price repeatedly stops falling
📌 Step 3: Draw a horizontal line across multiple touches
If the price reacts several times at the same level, that area becomes strong support.
🔹 How to Identify Resistance
📌 Find levels where price repeatedly fails to break higher
📌 Connect the rejection points
📌 Mark horizontal resistance zones
The more touches, the stronger the resistance.
🔥 Why Line Charts Work Well for S/R
✅ Cleaner structure
✅ Less fake breakouts from wicks
✅ Better for beginners
✅ Clear trend direction
📊 Simple Trading Strategy (Educational Only)
Buy near strong support
Sell near resistance
Wait for breakout confirmation
Use stop-loss below support
📌 Pro Tip
If support breaks with strong volume, it often turns into resistance (Support-Resistance Flip).
🎯 Conclusion
Line charts help traders focus on market structure and psychology. By marking repeated reaction levels, traders can easily identify high-probability support and resistance zones.
#TechnicalAnalysis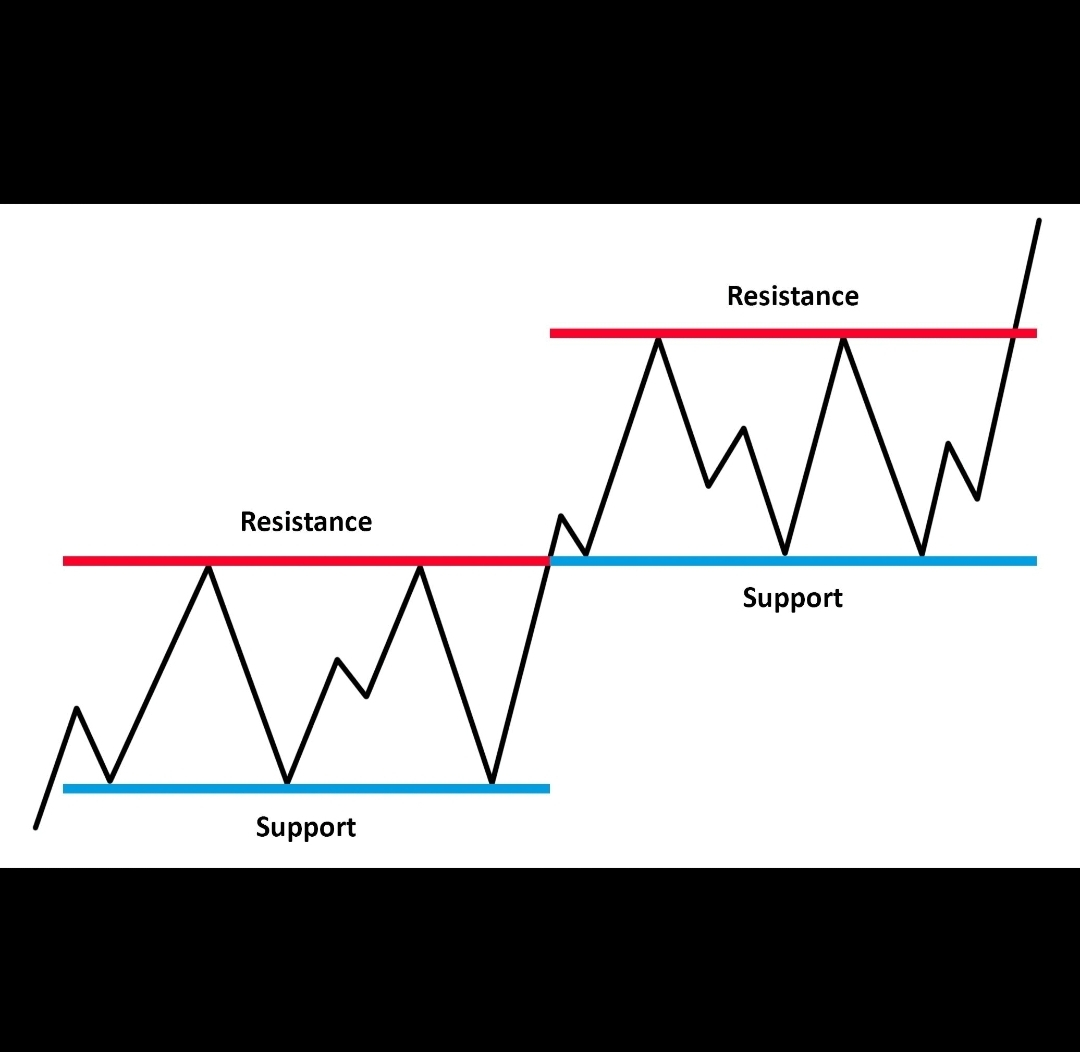 #SupportAndResistance #CryptoTrading #BTC #ETH #BNB