I call a lower low bullish when it clearly points to a trend reversal. Here we can tell because of the chart structure, marketwide action and lower volume on the second low compared to the first one.
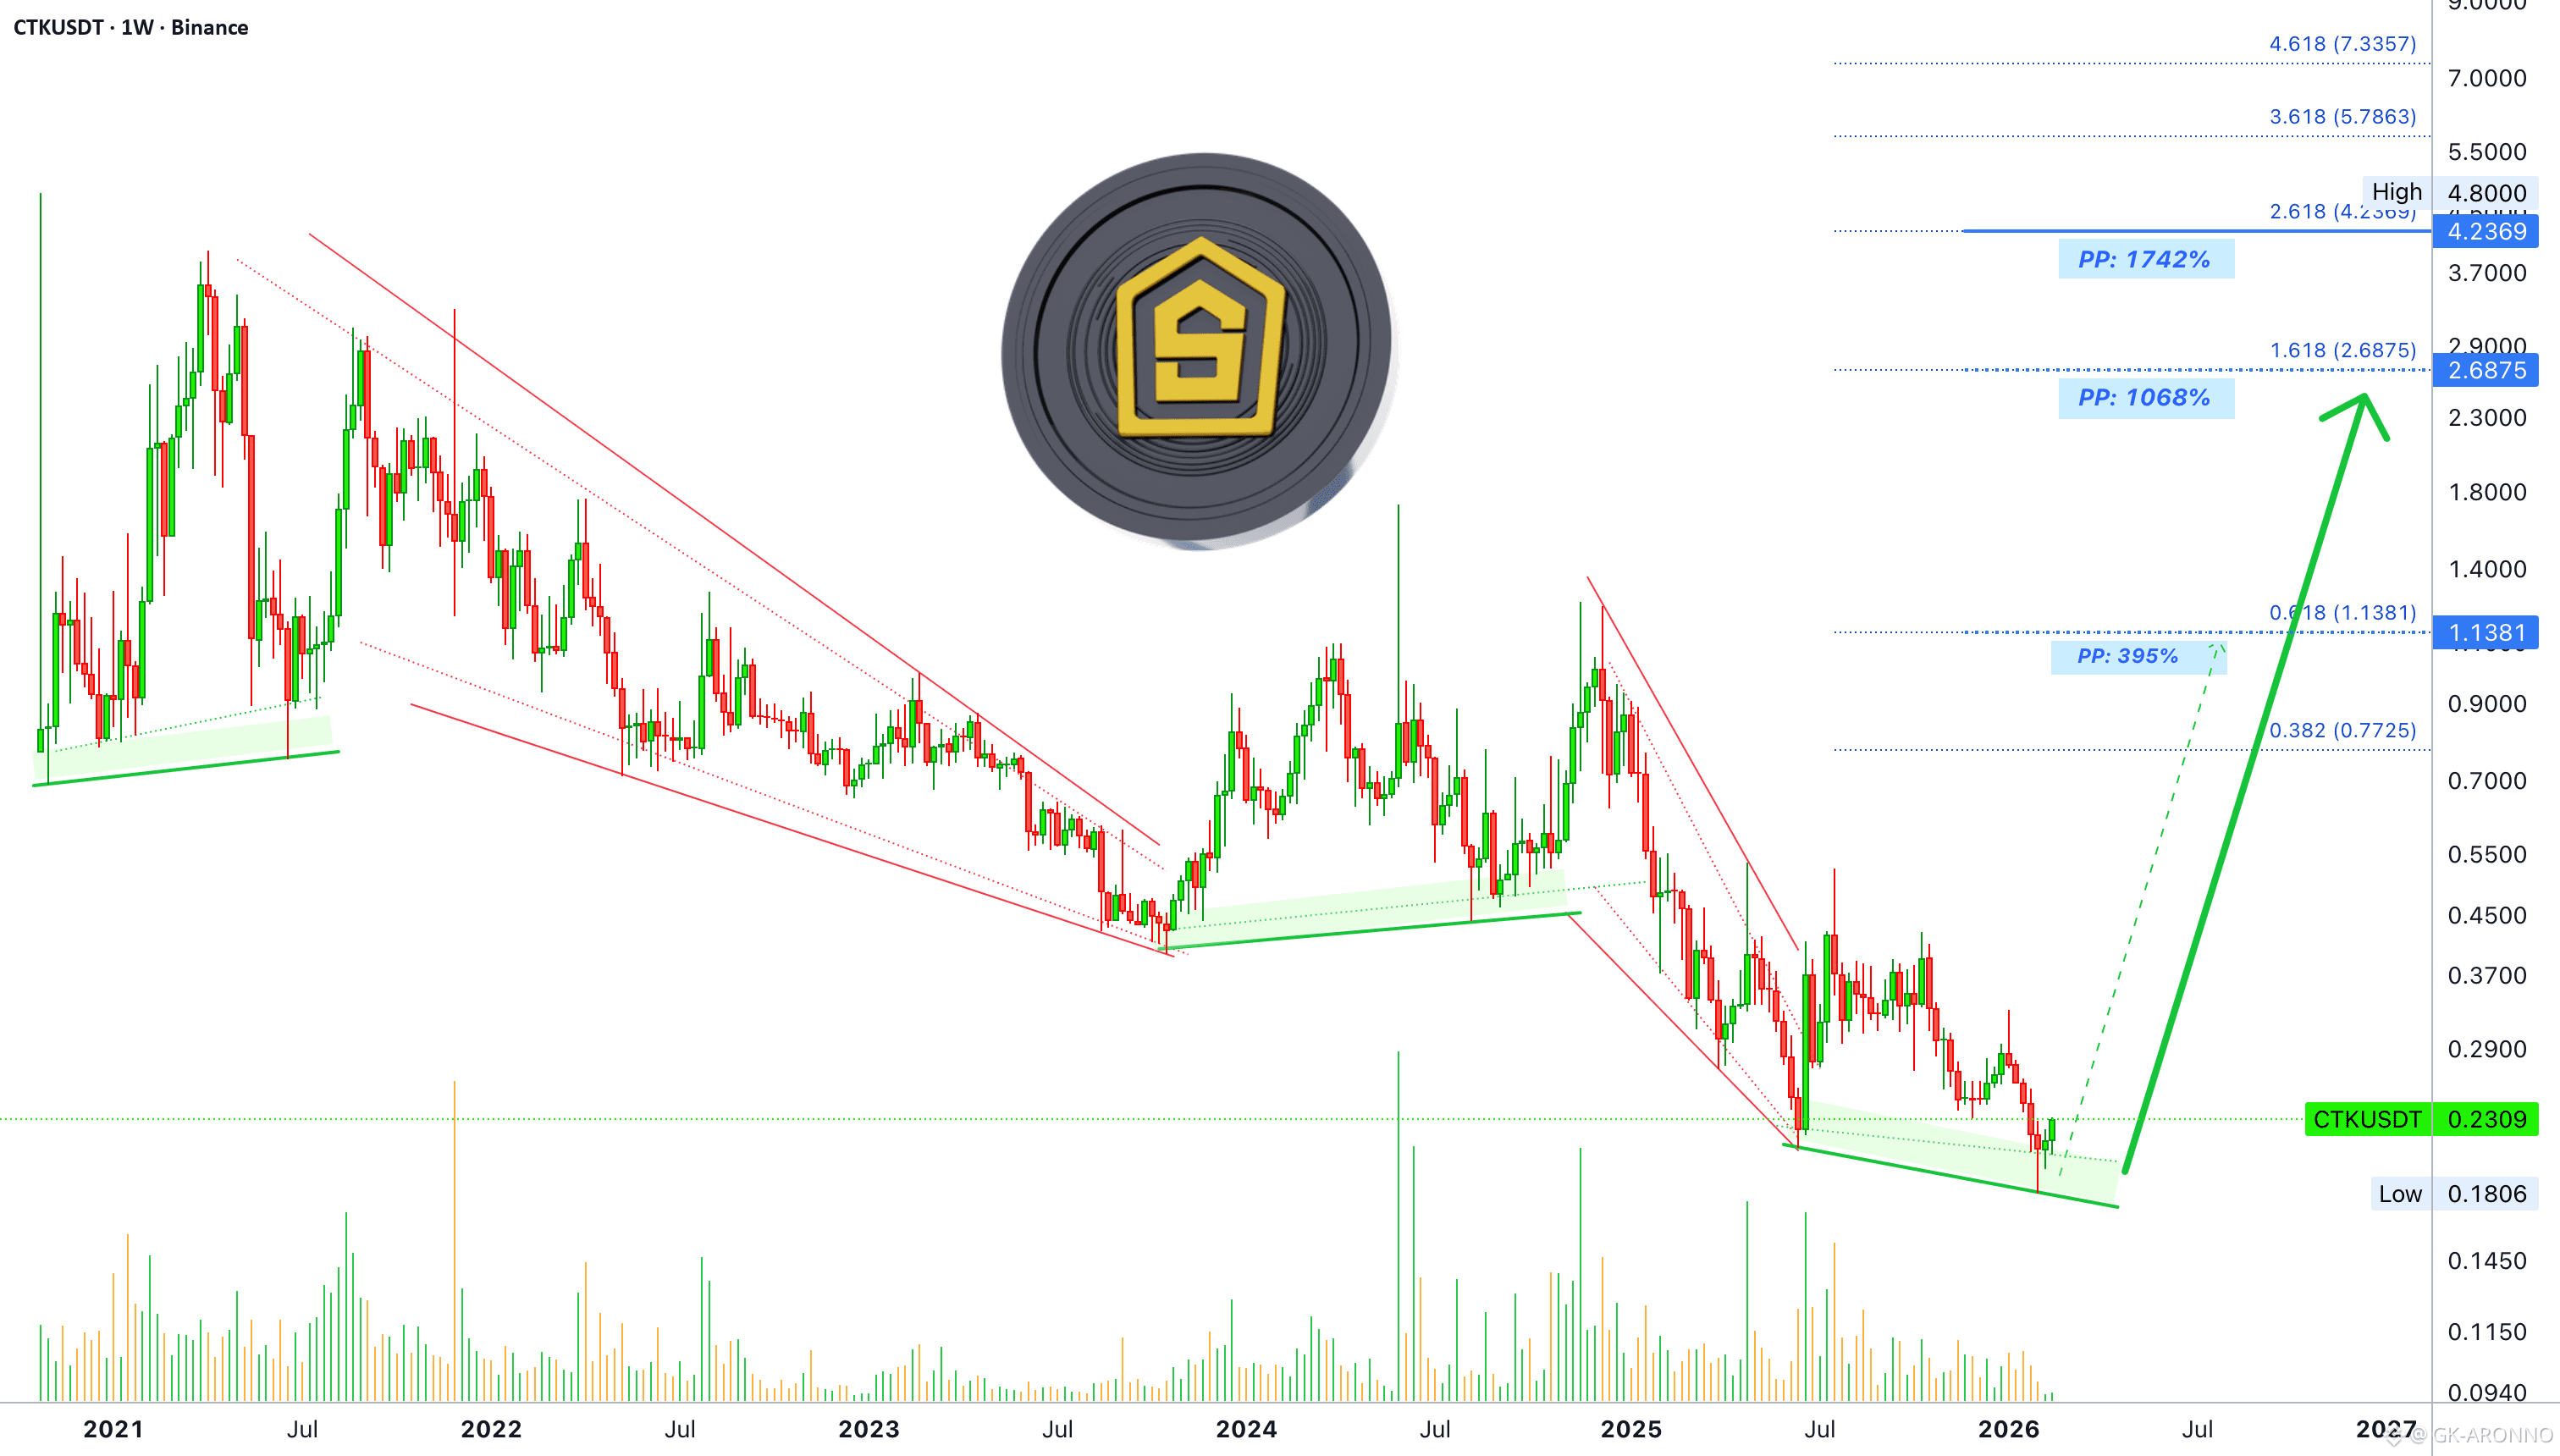
CTKUSDT (Shentu) is a project that we've been tracking and the chart looks much better now compared to several months ago. That is because we get lower prices, a better entry, before the period of sustained bullish action. The longer it takes for this phase to unfold, the longer it will last.
The stronger the crash, the bigger the rise.
Here also we can see a lack of a bearish trend—downtrend. I am using the logarithmic chart to be able to see the lows and highs and the candles for that matter, but if you were to set this chart to "linear" you can clearly see what I mean. True bottom prices. And, from this bottom we grow.
Last week was the first green week after five weeks red. This week is turning green almost reaching its end. Which means a green close and bullish confirmation. Which signals the start of a new wave of growth.
Hopefully, this will be a strong bullish wave, long lasting.
An easy target here shows 395%, this can be achieved within 1-2 months. Higher targets are also possible but this would require a long-term cycle, which sits between 3-6 months. Such a cycle always has a correction in-between, that is why it is wise to take profits when resistance hits.
Take profits when prices are up even if only a small portion. Sell, always, when there is a rise. Get used to buying only when the market is depressed and prices are low.
There is much waiting when buying at bottom prices, but in this way you can't go wrong.
Namaste.
✅ Trade here on $CTK