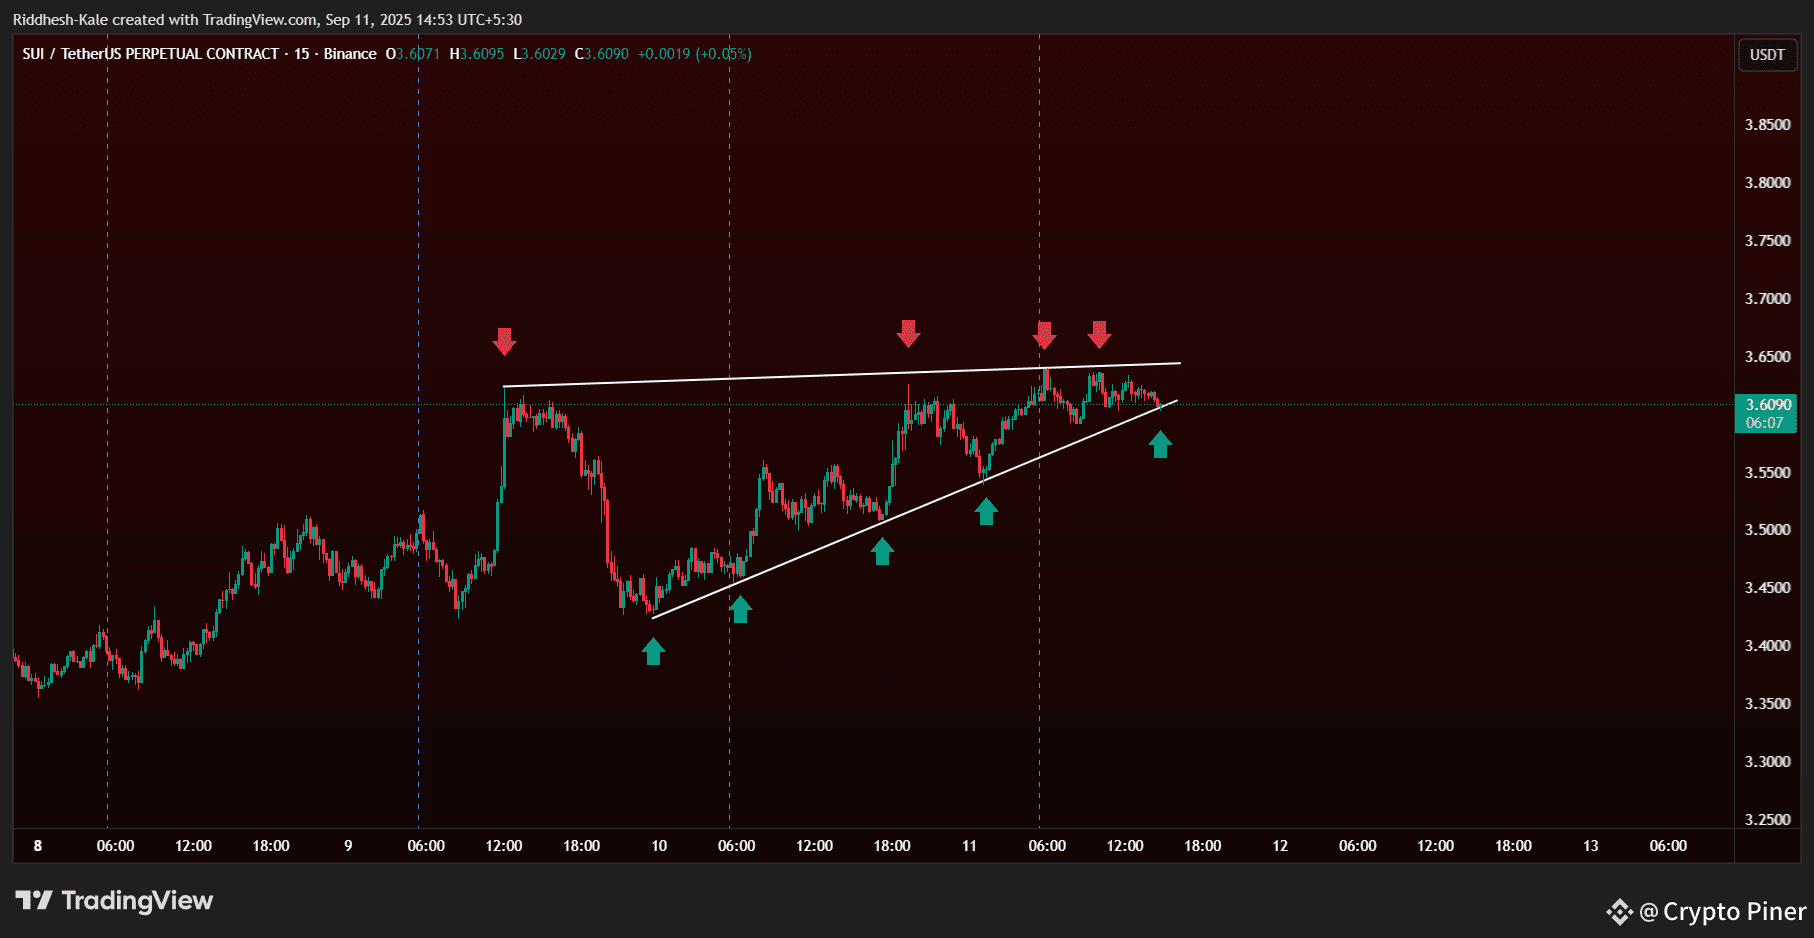
The Ascending Triangle is a bullish continuation pattern. It forms when the price creates higher lows (🔼) while facing consistent resistance at the same horizontal level (🔴).
🧐 How to Identify It
1) Flat Resistance Line
Price hits the same level multiple times and gets rejected
This creates a horizontal line on top
2) Rising Support Trendline
Each dip forms a higher low, indicating buying pressure
Connect the swing lows with a rising trendline

📊 How to Trade It
1) Entry 📌 : Breakout Entry: Enter when price breaks and closes above the resistance line with high volume 💥 , Conservative traders wait for a retest of the breakout zone (resistance becomes support).
2) Target 🎯 : Measure the height of the triangle and project it upward from the breakout point
Example: If triangle height = $0.30, add $0.30 above breakout
3) Stop Loss 🛡️ : Below the last higher low Or slightly below the triangle support trendline
🔍 Real Example $SUIUSDT (15-min chart)