#WriteToEarnUpgrade #institutionaltrading #BinanceBlockchainWeek #USJobsData #TradeToWin
"This guide explains everything in simple language so beginners can read charts like a pro".
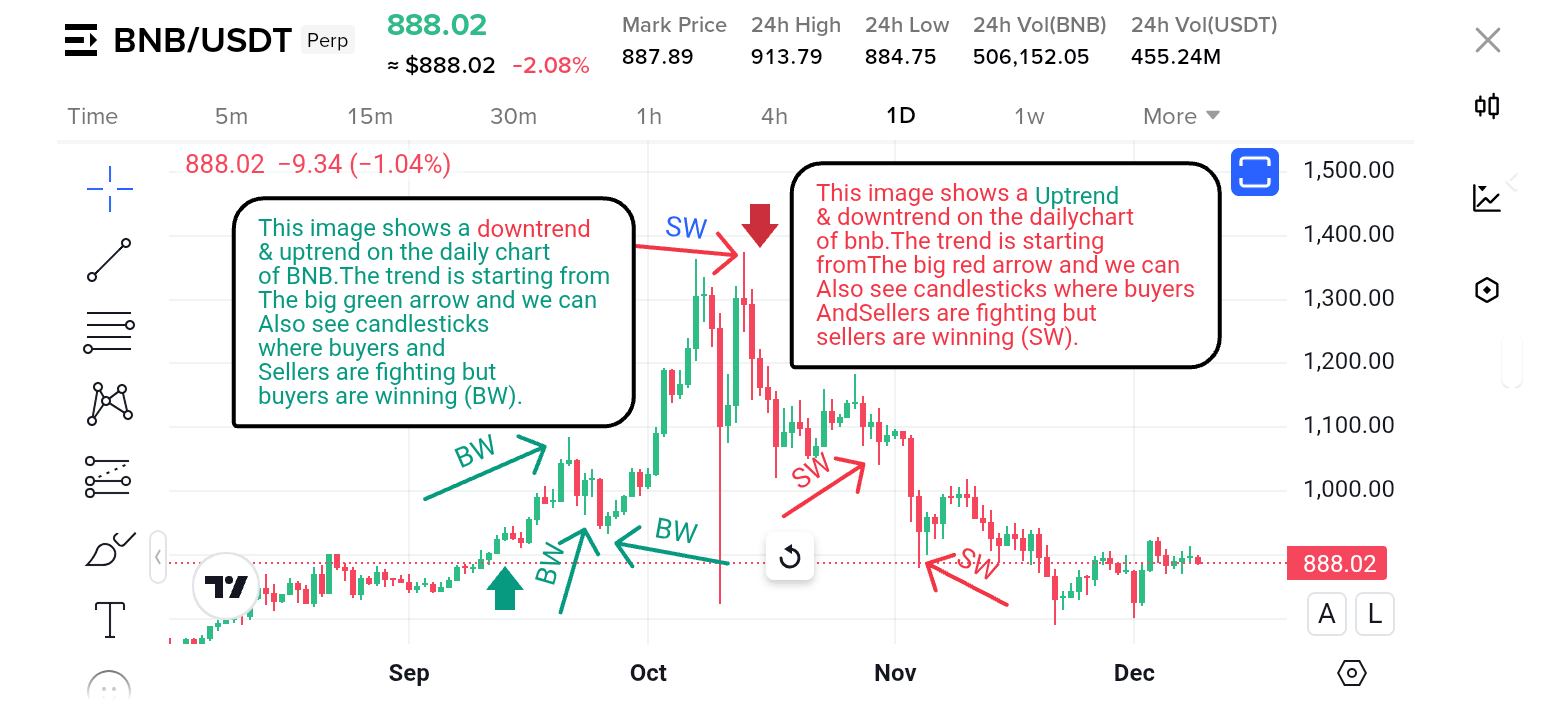
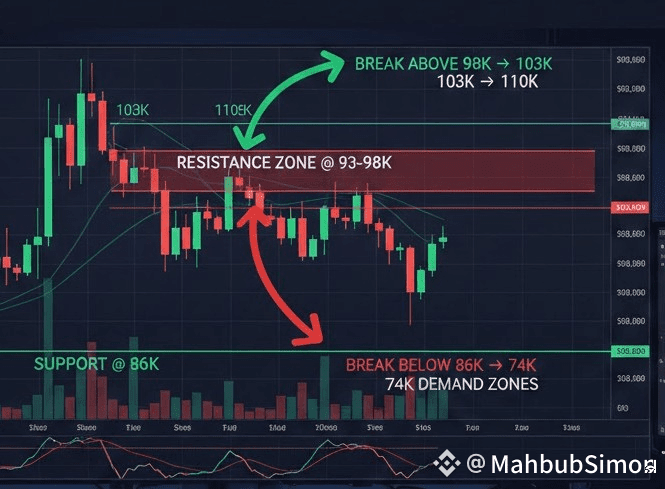
Here is an chart example:
If you’re new to trading, candlestick charts are one of the most important tools you’ll use. Every candle tells a story about buyers, sellers, and market sentiment. Understanding candlestick formation and wicks will help you make better trading decisions.
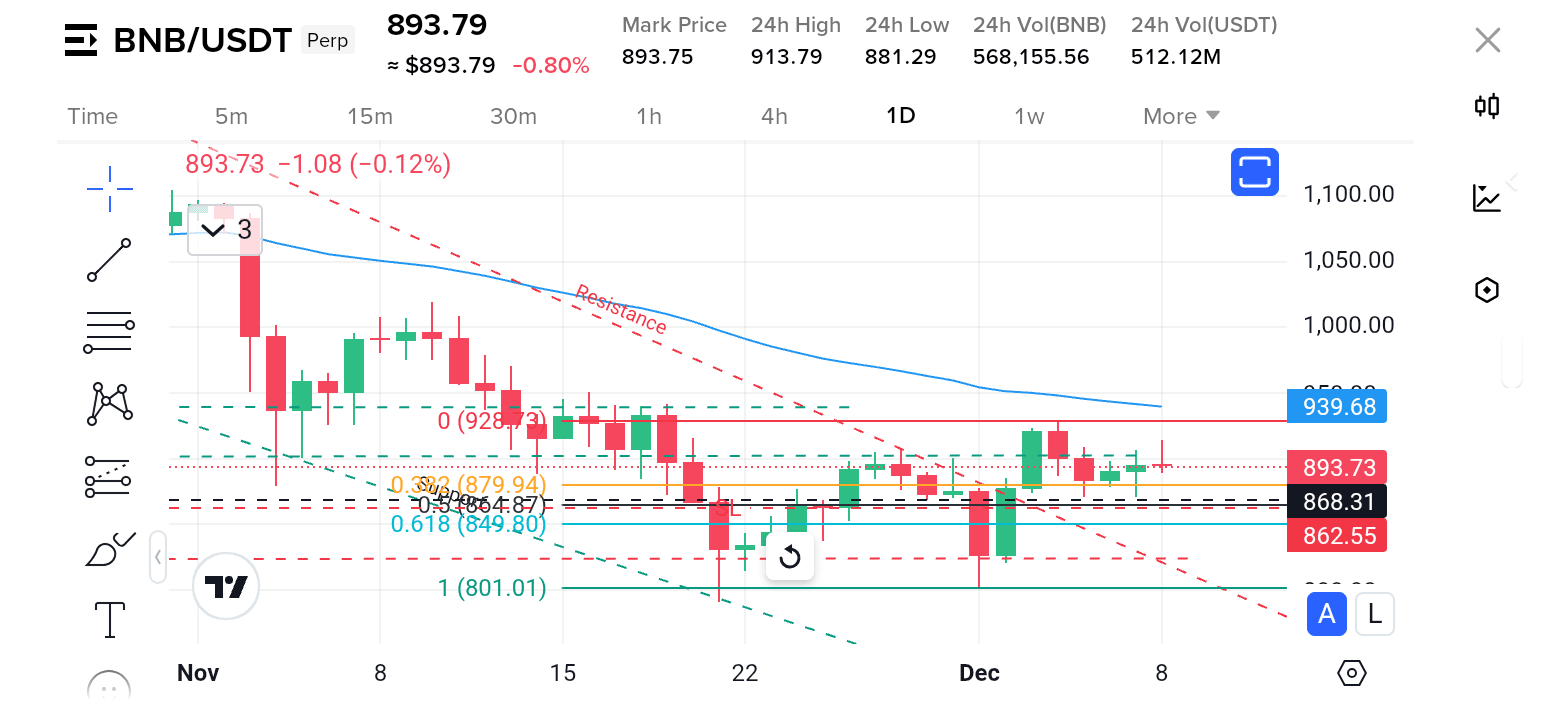
Here is an example: (BTC day-time chart drawn with support/demand and resistance zones).⬇️
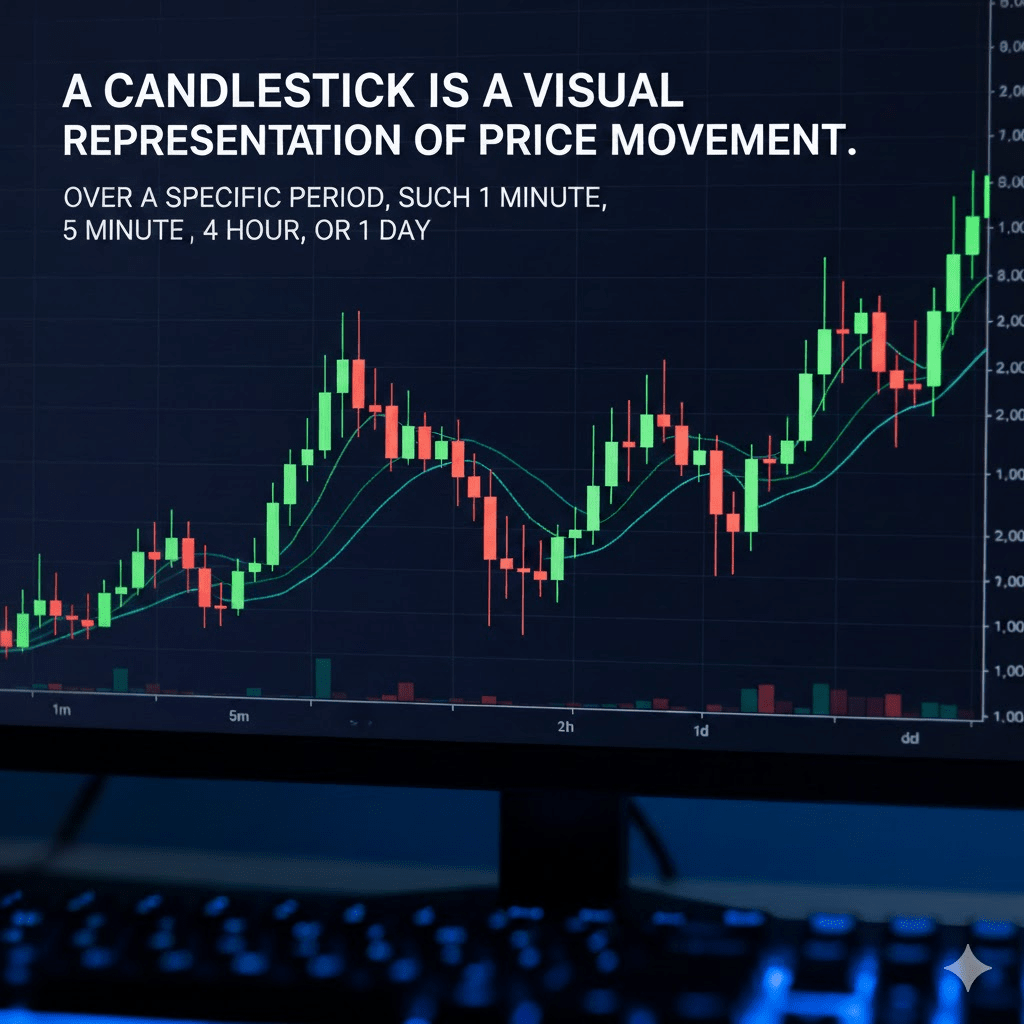
📊What Is a Candlestick? Its Structure & Details:
A candlestick is a visual representation of price movement over a specific period, such as 1 minute, 5 minutes, 1 hour, or 1 day.⬇️
Here is an example:
Each candle has four main components:
1. Open Price – Where the price started during that period
2. Close Price – Where the price ended
3. High Price – The highest price reached
4. Low Price – The lowest price reached ⬇️
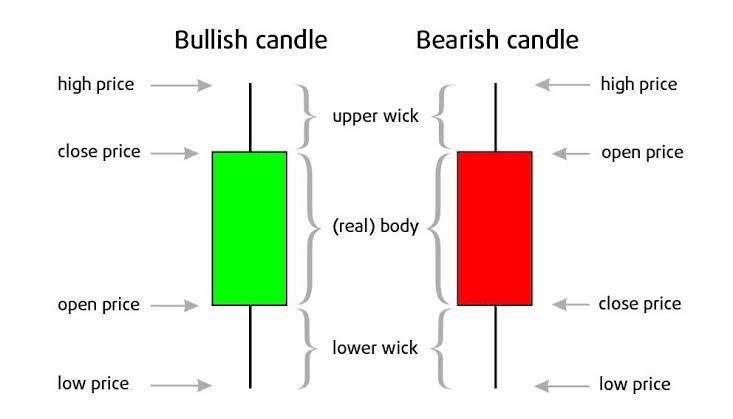
Candlestick Body: ⬆⬆
The body of the candle shows the difference between open and close prices.
• Bullish Candle (Green/White) – Close > Open
⬆️ Price moved upward
• Bearish Candle (Red/Black) – Close < Open
⬇️ Price moved downward
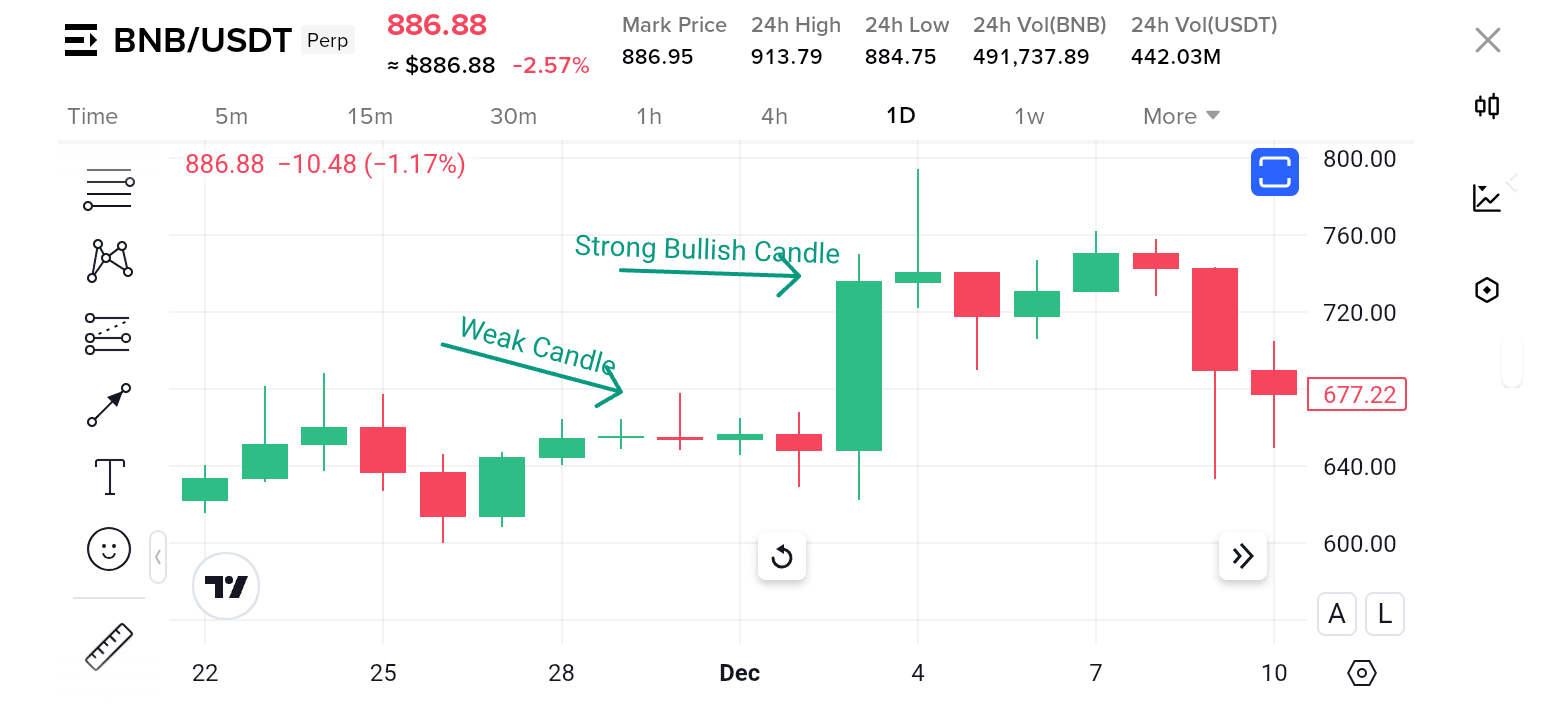
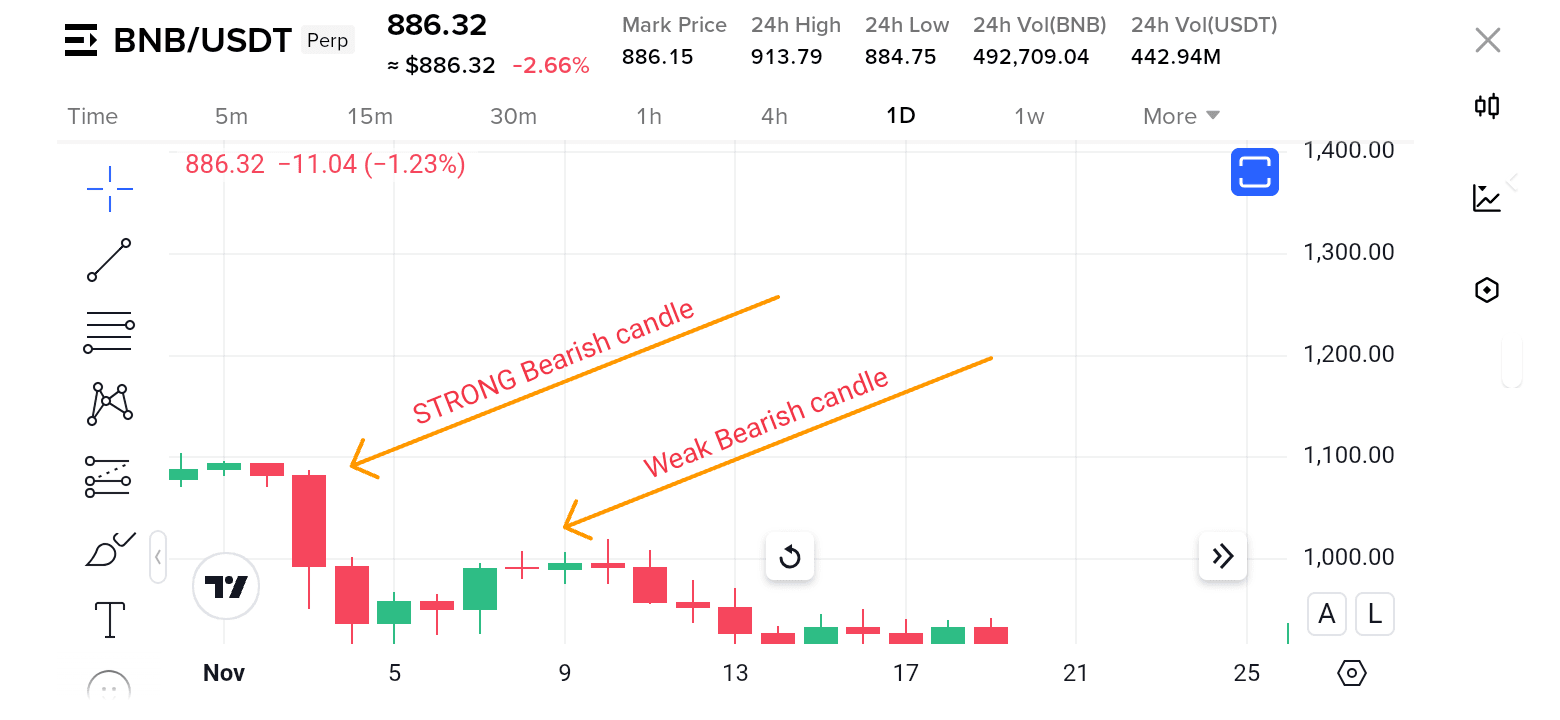
The body size indicates the strength of buyers or sellers:
• Large body → strong momentum⬇️
• Small body → weak momentum / indecision⬇️