🔍 Structure & Trend
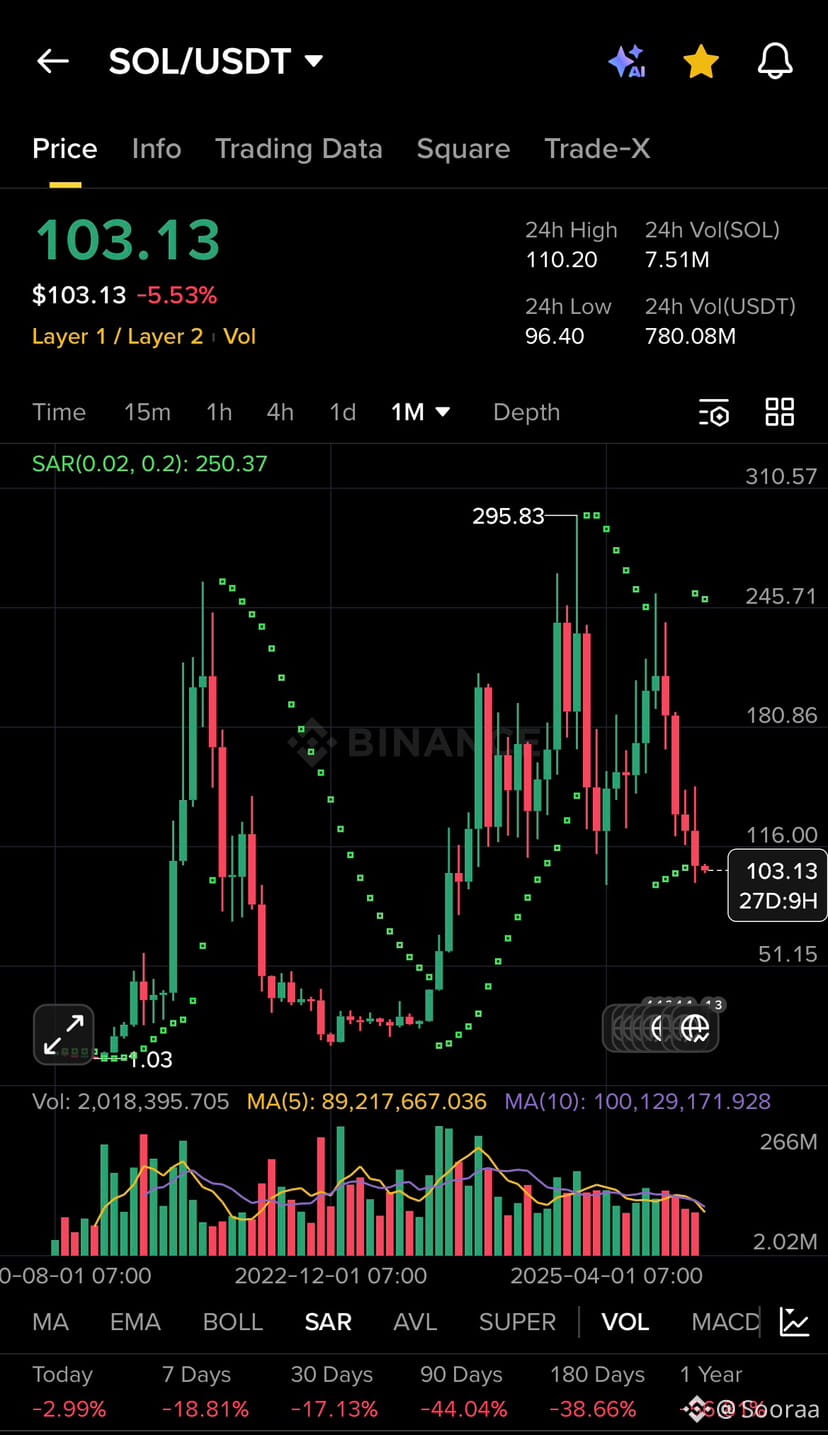
SOL peaked around $295.8, then formed a lower high and rolled over.
Price has been making lower highs and lower lows, confirming a bearish market structure.
The recent drop pushed SOL back into the $100–105 demand zone, a psychologically important level.
📉 Indicators
Parabolic SAR dots are above price, signalling the trend is still bearish.
Volume has declined compared to previous rally phases → suggests weak buying pressure.
Monthly performance metrics show sustained weakness:
30D: -17%
90D: -44%
1Y: -56%
🧱 Key Levels
Support:
$96–100 (recent monthly low & psychological support)
Below that, risk opens toward $85–90
Resistance:
$116 (previous breakdown area)
Stronger resistance near $180
🧠 Market Read
This looks like a post-distribution phase after a failed recovery rally.
Price is consolidating near the bottom, which can mean:
Either base-building before a bounce
Or continuation lower if $100 fails