📌 Bitcoin (BTC) — Market & Price Analysis
Bitcoin (BTC) is the original and largest cryptocurrency by market cap. It’s widely used as a store of value, a hedge against inflation, and a benchmark asset for the broader crypto market.
CoinMarketCap
📊 Current Price Snapshot
As of the latest updates:
• BTC price: Around $70,700 – $71,700 USD (varies with market activity)
• Market cap: Over $1.4 trillion USD �
• All-time high: ~$126,198 (October 6, 2025) �
• Circulating supply: ~19.98M BTC �
CoinMarketCap
CoinMarketCap
CoinMarketCap
CoinMarketCap
Despite trading well below its all-time peak, Bitcoin remains the dominant crypto. �
CoinMarketCap
📉 Recent Market Trends
Bearish pressure & volatility:
• BTC has recently experienced significant sell-offs, dropping from near-peak levels and below key technical supports, reflecting broader risk-off sentiment in markets. �
• ETF outflows and tech stock weakness have added selling pressure. �
• However, occasional rebounds show buyers stepping in near perceived support zones. �
Financial Times +1
MarketWatch
Reuters
This mixed environment suggests short-term volatility with both bearish and bullish forces at work.
📈 Key Technical Levels to Watch
Traders often focus on:
• Support zones: psychological levels like ~$60,000–$65,000 (historical support areas) �
• Resistance: recent highs near $90,000+ tightening upside pressure �
• Consolidation range: Bitcoin has traded in sideways patterns between notable levels over weeks, reflecting indecision. �
Financial Times
MEXC
MEXC
Candlestick patterns and technical indicators (like moving averages, RSI, MACD) help interpret momentum but are not guarantees of direction.
📉 Candlestick Chart (Illustrative)
Here’s an example candlestick chart style you might see for Bitcoin (live charts are available on TradingView / CoinMarketCap / exchanges):
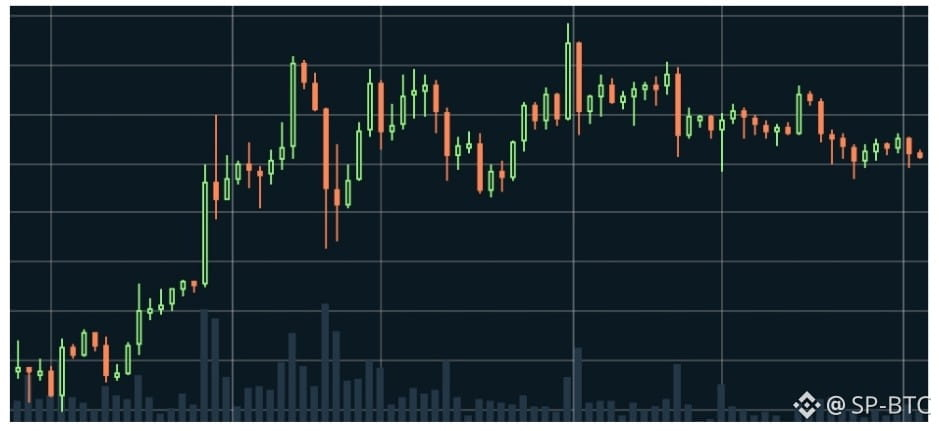 How to read it:
🔹 Green candle = price closed higher than it opened. �
Cointelegraph
🔴 Red candle = price closed lower than it opened. �
Cointelegraph
Wicks (lines) show the intraday high and low prices. �
Cointelegraph
Live BTC charts display multiple timeframes (1h, 4h, 1D, 1W) that help traders spot trends or reversals. �
btcgoto.com
🧠 Summary
✔ Bitcoin remains the flagship digital asset with the largest market cap. �
✔ Current price action shows volatility and consolidation after steep price swings. �
✔ Institutional flows and macro factors (ETFs, risk sentiment) strongly influence short-term price movement. �
✔ Technical charts like candlesticks are essential tools to visualize market behavior. �
CoinMarketCap
MEXC
MarketWatch
Cointelegraph
⚠️ This is educational and informational — not financial advice. Always do your own research (DYOR) before making investment decisions.
