The journey of Build on Bitcoin (BOB) in the public market has been a textbook example of crypto's inherent volatility and the complex interplay between hype, fundamentals, and pure market mechanics. Following an explosive debut on the Bithumb exchange in early December that saw its price surge dramatically, BOB has since entered a prolonged phase of consolidation and price compression. This has left many market participants in a state of watchful indecision, questioning whether the current lull is a period of accumulation before the next leg up, or a distribution phase foreshadowing further downside. This analysis will dissect the technical structure on the chart, contextualize it with recent fundamental developments, and outline key scenarios for traders and investors to monitor as BOB approaches a potential inflection point.
Market Snapshot:
BOB is currently in a state of delicate equilibrium. The initial catalyst, a major exchange listing, has fully played out, and the speculative fervor has subsided. The price action has transitioned from a high-volatility, high-volume environment to one of extreme quietude. This is a critical phase where the asset's true support level, based on long-term conviction rather than short-term hype, is established. For those who entered during the initial surge, this period is a test of patience, marked by a significant drawdown from the local top. For prospective participants, it represents a state of ambiguity; the asset is trading far below its recent high, which could be perceived as a discount, but the lack of upward momentum presents a clear risk. The overarching market structure has shifted from a clear, albeit brief, uptrend to a defined downtrend, which has now flattened into a sideways range. This compression, particularly after such an expansive move, suggests that energy is being coiled, and a significant move is becoming increasingly probable. The key question is in which direction that energy will be released.
Chart Read:
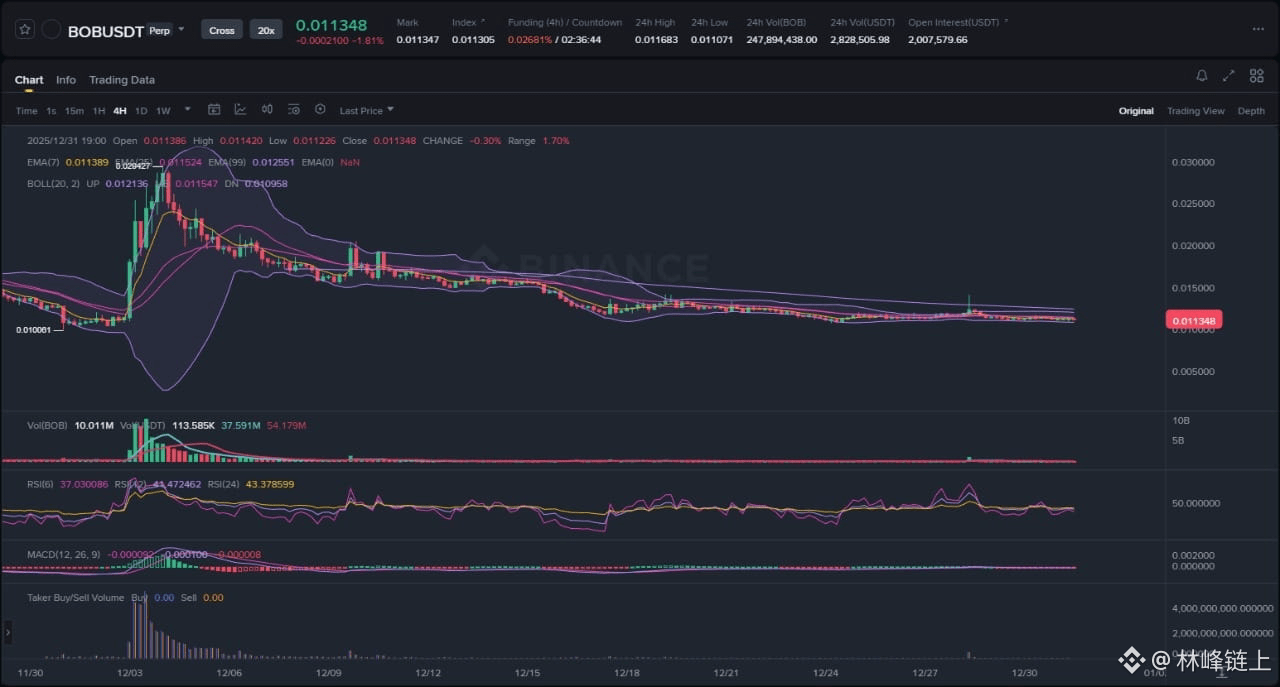
An examination of the 4-hour BOBUSDT perpetual chart reveals a narrative of two distinct phases. The first phase, beginning around December 3rd, was a classic impulsive wave upward. This was characterized by a massive volatility expansion, clearly visible as the Bollinger Bands blew wide open. The move was accompanied by an immense spike in volume, confirming the authenticity of the buying pressure. This was not a gradual climb but a vertical ascent, a hallmark of a market reacting to a significant external catalyst, in this case, the Bithumb listing. This impulsive move established a local swing high, which now serves as a major psychological and technical resistance level for the foreseeable future.
The second phase, which has dominated the price action for the remainder of the month, has been a protracted corrective structure. Immediately following the peak, the price entered a distribution phase, marked by a steady decline with low-volume bounces that failed to reclaim any significant prior levels. The short-term Exponential Moving Averages (EMAs) began acting as dynamic resistance, guiding the price lower. This entire downtrend has now culminated in the current structure: an extremely tight consolidation range. The Bollinger Bands have squeezed into their narrowest width since the listing, signaling a historic contraction in volatility. Such squeezes are often precursors to significant volatility expansion. Concurrently, volume has tapered off to negligible levels, indicating a ceasefire between buyers and sellers and a general lack of market interest at these prices. The Relative Strength Index (RSI) is hovering in neutral territory, below the 50 midline, reflecting the absence of directional momentum. Based on the prolonged downtrend and the failure to hold any of the initial gains, the prevailing technical bias is neutral with a slight bearish tilt. The onus is on the buyers to prove they can absorb the latent supply and break the current market structure to the upside.
News Drivers:
The fundamental backdrop for BOB presents a compelling, and somewhat conflicting, narrative when juxtaposed with the recent price action. We can categorize the relevant news into two primary themes.
Theme 1: Strong Project Fundamentals (Bullish)
This theme is built on two pillars: successful fundraising and major exchange access. In mid-November, the Build on Bitcoin project announced it had hit $25 million in total funding, bolstered by a $4.2 million public sale. This is a fundamentally bullish signal, indicating significant investor confidence in the project's vision, team, and long-term potential as a hybrid Layer-2 solution. A well-capitalized treasury is crucial for sustained development, marketing, and ecosystem growth. This was followed by the landmark listing on South Korea's Bithumb exchange on December 3rd. Gaining access to one of the largest and most active retail crypto markets globally is a major milestone that provides critical liquidity and legitimacy. These events, taken together, form the long-term bullish case for the project.
Theme 2: Historical Noise and Potential Market Confusion (Mixed)
An important point of clarification arises from older news reports from mid-2023. These reports detail a memecoin, also using the ticker BOB, that was embroiled in a controversy with Elon Musk, who labeled a related Twitter bot a scam, causing that token's price to collapse. It is absolutely critical for market participants to understand that the "Explain this Bob" memecoin is an entirely separate and unrelated project from the "Build on Bitcoin (BOB)" Layer-2. However, the shared ticker symbol introduces a non-trivial risk of market confusion. This could lead to misinformed investment decisions and reputational transference, where negative sentiment associated with the memecoin could inadvertently affect the Layer-2 project in the eyes of less diligent researchers.
The divergence between the bullish fundamental news and the bearish price action since the listing peak points to a classic "sell the news" event. It is probable that early investors and insiders, who were privy to the project's progress and upcoming listing, accumulated positions at lower prices. The listing itself, and the retail-driven frenzy that followed, provided the perfect high-liquidity event for these early participants to realize their profits. This heavy selling pressure from early stakeholders easily overwhelmed the new wave of buying, leading to the sustained price decline we have observed.
Scenario A: Bullish Reversal and Breakout
For a bullish scenario to materialize, a clear sequence of events must unfold. The first and most critical signal would be a decisive breakout above the upper boundary of the current, very tight consolidation range. This move must be accompanied by a significant and sustained increase in volume. A low-volume move would be a red flag, suggesting a lack of conviction and increasing the probability of it being a "fakeout" or liquidity grab. Following the initial breakout, the price would need to successfully reclaim the median line of the Bollinger Bands and the short-term EMAs, turning them from resistance into support. The true confirmation of a structural shift, however, would be the establishment of a higher low, followed by a successful push to establish a higher high, breaking the market's long-standing pattern of lower highs and lower lows. This would signal that the corrective phase is over and a new accumulation cycle has begun.
Scenario B: Range Breakdown and Downside Continuation
The alternative scenario, which aligns with the prevailing bearish momentum, involves a failure to hold the support of the current range. This would be signaled by a clean break and 4-hour candle close below the consolidation low. Similar to the bullish scenario, confirmation would be required in the form of expanding sell-side volume. A breakdown would invalidate any immediate bullish thesis and suggest that the distribution phase is not yet complete. This would open the path to further downside price discovery, as the market would seek out the next significant pocket of liquidity. Potential targets could include price levels observed in the run-up to the Bithumb listing, as these represent areas where a larger base of buyers may have previously established interest. A breakdown from this prolonged period of low volatility could be swift and severe.
What to Watch Next:
1. Volume Confirmation: Volume is the ultimate truth-teller in this market structure. Do not trust any breakout or breakdown that is not supported by a clear spike in trading volume. It is the single most important variable to watch.
2. The Bollinger Band Break: The ongoing "squeeze" is the dominant technical pattern. The first 4-hour candle to close decisively outside either the upper or lower band will likely dictate the direction of the next short-to-medium term trend.
3. Open Interest Dynamics: In the perpetuals market, a price move accompanied by a corresponding rise in Open Interest suggests new capital is entering the market and supporting the trend. Conversely, a price move on declining OI may signal a short-squeeze or long-squeeze, which is less sustainable.
Risk Note:
This analysis is for informational purposes only and does not constitute investment advice. The cryptocurrency market is subject to high volatility and risk. All participants should conduct their own thorough research. It is particularly important to distinguish between the Build on Bitcoin (BOB) Layer-2 project and the unrelated memecoin that shares the same ticker, as this represents a unique source of potential confusion and risk.
The market has given a clear signal of indecision; patience is required until a directional bias is confirmed.