Uniswap (UNI) has recently captured the attention of market participants following a powerful rally, but now finds itself at a critical technical juncture. After an impressive upside move, the price has entered a corrective phase, leaving traders and investors to question whether this is a healthy pullback before the next leg up, or the beginning of a more significant distribution phase. The current price action is characterized by contracting volatility and a struggle around key moving averages, suggesting a period of indecision. This analysis will dissect the chart, evaluate the current narrative vacuum, and outline two primary scenarios to watch for in the sessions ahead.
Market Snapshot:
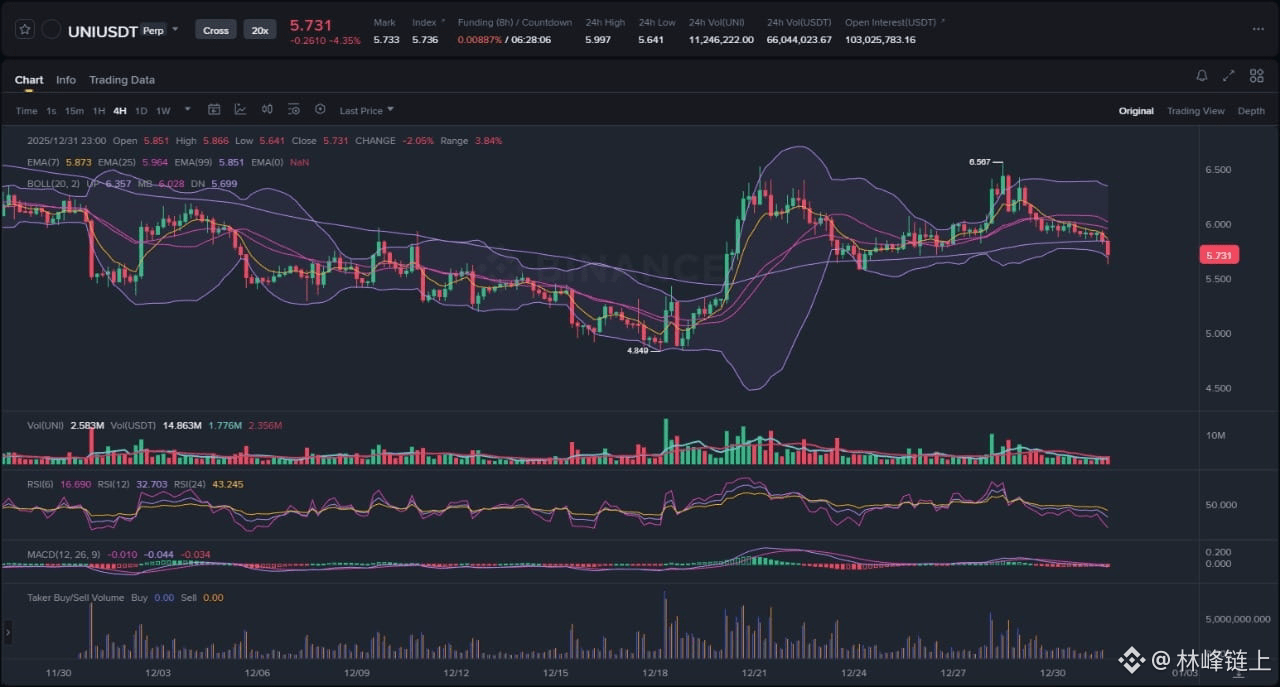
At the time of writing, UNI is trading around the 5.731 level, reflecting a notable retracement from its recent peak. The price action is contained within a tightening range after a period of significant volatility expansion. This corrective movement comes after a powerful impulse wave that began in mid-December, which saw UNI surge from below 5.000 to a local high near 6.587. The current phase is defined by decreasing volume, which is typical of consolidation. However, it also indicates a lack of immediate directional conviction from either bulls or bears. As a leading decentralized exchange token, UNI's performance is often seen as a bellwether for the broader DeFi sector. Its present consolidation reflects a wider market pause, as major assets also seek clear direction. The key for UNI will be whether it can hold crucial support levels derived from its recent ascent or if it succumbs to selling pressure in the absence of fresh catalysts.
Chart Read:
The 4-hour chart for UNI/USDT presents a clear narrative of a market in transition. The dominant feature is the powerful, impulsive move upwards from the 4.849 swing low. This rally was characterized by a sharp expansion of the Bollinger Bands and was supported by a significant increase in volume, indicating strong institutional or retail buying pressure. This phase established a clear bullish market structure with a series of higher highs and higher lows.
However, the trend stalled upon reaching the 6.587 resistance level. Price action at this peak showed signs of exhaustion, with multiple rejections and the formation of a local top. Following this rejection, the price broke down below its key short-term Exponential Moving Averages (EMAs), which have now flipped from dynamic support to dynamic resistance. Currently, the price is testing the lower Bollinger Band, a classic sign of bearish pressure or a potential mean reversion opportunity.
My main bias is neutral to slightly bearish in the immediate short term. This is based on the confluence of several technical indicators. First, the price is trading below the EMA(7), EMA(25), and EMA(99), confirming a loss of short-term bullish momentum. Second, the MACD indicator has crossed below its signal line and is in negative territory, signaling that bearish momentum is currently in control. Third, the RSI has fallen below the 50-midpoint, reinforcing the idea of weakened buying pressure. While the preceding uptrend was strong, the current structure points towards a period of correction or consolidation at best, with a risk of further downside if immediate support levels fail to hold.
News Drivers:
A notable factor influencing UNI's current price action is the apparent absence of significant, protocol-specific news or catalysts. In such a "catalyst vacuum," the market's behavior becomes more insular and technically driven. Two primary themes emerge from this situation.
Theme 1: Technical Dominance (Neutral). With no major fundamental developments to sway sentiment, traders are relying almost exclusively on chart patterns, order flow analysis, and key technical levels. Price action becomes a self-fulfilling prophecy where reactions at well-defined support and resistance zones are more pronounced. The current corrective drift can be interpreted as organic profit-taking after a strong run, a process that will resolve based on the technical strength of buyers and sellers at critical price points rather than external news flow.
Theme 2: High Macro Correlation (Neutral). In the absence of its own narrative, an asset like UNI becomes more tightly correlated to the broader market, particularly to bellwethers like Bitcoin and Ethereum. A risk-on impulse across the market would likely lift UNI, while a risk-off sentiment would almost certainly apply downward pressure. Therefore, monitoring the overall market direction is paramount for assessing UNI's potential trajectory. This lack of independent news does not conflict with the chart; rather, it explains why the price action has become corrective and technically contained after the initial momentum faded.
Scenario A: The Corrective Wave Deepens
The primary scenario, given the current bearish momentum on the 4-hour chart, is a continuation of the corrective structure. This would involve the price failing to reclaim the resistance cluster formed by the EMAs and the Bollinger Band midline, which sits around the 6.000 psychological level. In this scenario, any attempt to rally would be met with selling pressure, resulting in the formation of another lower high. The trigger for a further leg down would be a decisive break and close below the recent swing low around 5.641. This breakdown would need to be accompanied by an expansion in sell-side volume to confirm bearish conviction. If this support level fails, it opens up the possibility of a deeper retracement towards the next significant liquidity pockets. These would likely be found near the 50% Fibonacci retracement level of the entire impulse move from 4.849 to 6.587, or at the prior consolidation zone observed before the major breakout.
Scenario B: The Pullback Finds a Floor
The alternative scenario involves the invalidation of the short-term bearish structure. This would occur if bulls step in to defend the current support zone, establishing a higher low relative to the broader uptrend. The first and most critical sign of this reversal would be a strong, volume-supported push back above the EMA cluster and the Bollinger Band midline. A simple wick above this area would be insufficient; the market would need to see a 4-hour candle close firmly above this resistance, followed by a successful retest of this zone as new support. This price action would signal that the corrective phase is over and that buyers have reassumed control. The MACD would likely exhibit a bullish crossover, and the RSI would need to reclaim the territory above 50 to confirm a resurgence in momentum. If this scenario plays out, the initial target would be a retest of the recent swing high at 6.587. A break beyond that level would confirm a full continuation of the prior uptrend.
What to Watch Next:
For market participants monitoring UNI, several key elements will provide clues about the next directional move. First, the reaction at the EMA cluster and Bollinger Band midline is the most immediate test. A firm rejection reinforces the bearish case, while a reclaim and hold signals a potential bullish reversal. Second, pay close attention to the volume profile. The current low volume is indicative of indecision. A significant spike in volume accompanying a move in either direction will serve as confirmation. A high-volume breakdown is a strong bearish signal, whereas a high-volume breakout above resistance is a strong bullish signal. Finally, watch the momentum oscillators. A potential bullish divergence on the RSI, where the price makes a slightly lower low but the RSI forms a higher low, could be an early warning sign that selling pressure is waning and a reversal is imminent.
Risk Note:
This content is for informational purposes only and does not constitute financial or investment advice. The cryptocurrency market is subject to high volatility and risk. All participants should conduct their own due diligence and risk assessment before making any trading or investment decisions.
UNI's short-term future will be determined by its ability to resolve the current consolidation with conviction.