The market for GIGGLE is currently exhibiting a textbook example of volatility contraction, a phase of market dynamics characterized by profound quiet and indecision. After a period of significant directional movement, assets often enter such a consolidation range where bulls and bears reach a temporary equilibrium. This coiling of price action, much like a compressed spring, stores kinetic energy. The longer and tighter the compression, the more powerful the eventual release is likely to be. For traders and analysts, this is not a time for complacency but for heightened observation, as the resolution of this balance will dictate the next major trend for the asset. Understanding the technical structure and the potential catalysts for a breakout is paramount in navigating what comes next.
Market Snapshot:
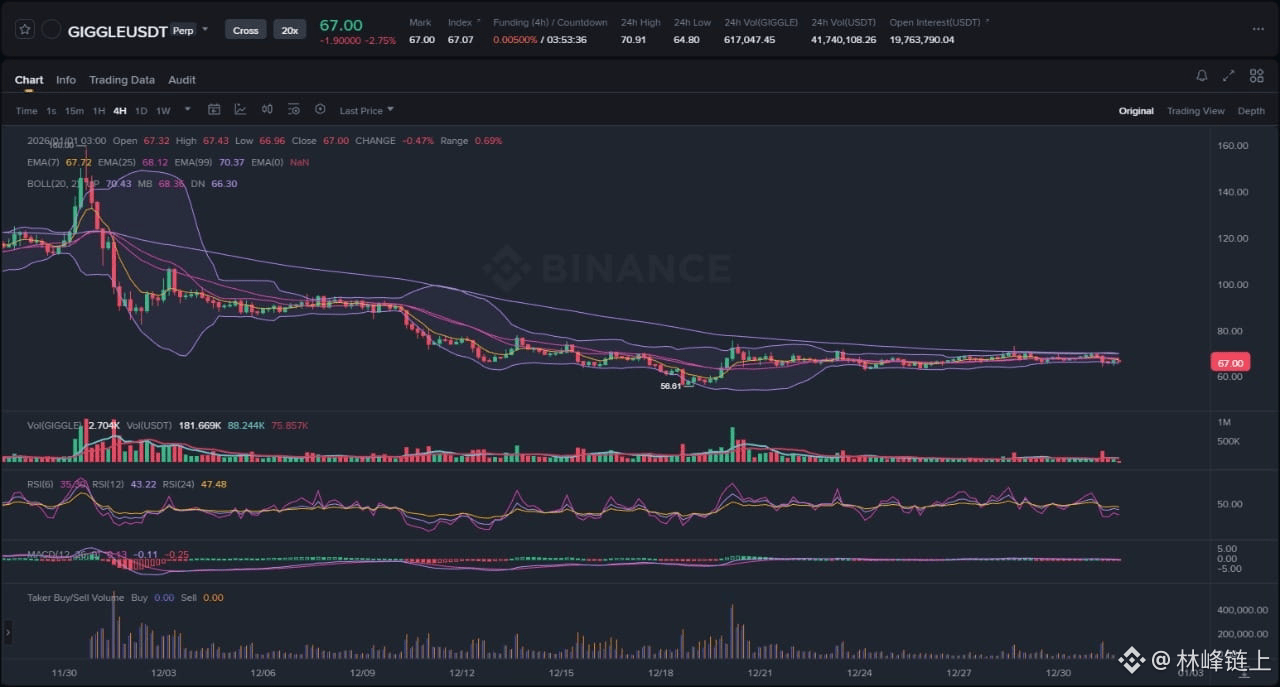
The GIGGLEUSDT perpetual contract is trading in a state of pronounced consolidation following a severe downtrend that commenced in late November. The asset experienced a cascade from levels above 130, ultimately finding a floor in the mid-50s. Since early December, however, the directional momentum has completely evaporated, replaced by a sideways chop within an increasingly narrow price band. This prolonged period of range-bound activity suggests that the initial selling pressure has been absorbed, but significant buying demand has not yet emerged to initiate a confident reversal. The market is in a wait-and-see mode, with participants poised for the next clear signal of intent from either side. The current price is therefore at a critical juncture, representing the midpoint of this established equilibrium.
Chart Read:
A technical deconstruction of the GIGGLEUSDT 4-hour chart reveals several key elements that define the current market structure. The most dominant feature remains the impulsive bearish wave from the prior month, which establishes the higher-timeframe context as bearish. The price action that followed is a classic consolidation or accumulation/distribution phase. Observable volatility, as measured by the Bollinger Bands, has reached a multi-week low. The bands are visibly squeezing, a technical condition that often precedes a violent expansion in price volatility. This "squeeze" indicates a sharp decrease in standard deviation from the mean, highlighting the market's extreme indecision.
Price is currently caught between the short-term Exponential Moving Averages (EMAs), which are themselves intertwined and flattened, offering no clear directional bias. This mechanical neutrality is mirrored in the momentum oscillators. The Relative Strength Index (RSI) is hovering around the 50-midpoint, the demarcation line between bullish and bearish territory, signifying a perfect balance of power. Similarly, the Moving Average Convergence Divergence (MACD) indicator is pinned to the zero line, with its histogram showing negligible momentum. Volume has also been tapering off consistently throughout this consolidation period. This volume decay is typical of ranging markets and suggests a lack of conviction from both buyers and sellers. The local swing low established around 56.61 serves as the clear downside support, while the upper portion of the range near the 70-75 area has acted as resistance. The primary bias remains cautiously neutral with a bearish undertone, simply because the consolidation has formed after a strong downtrend, and such patterns more frequently resolve in the direction of the prevailing trend.
News Drivers:
The current market structure for GIGGLE is developing within a catalyst vacuum. An extensive review reveals no significant project-specific updates, partnership announcements, macroeconomic news, or regulatory developments that could be reasonably interpreted as a fundamental driver for price. This absence of external stimuli is a crucial piece of the analytical puzzle.
Theme: Technical Dominance (Neutral to Bearish). In the absence of a fundamental narrative, price action becomes a purer reflection of technical factors, order flow dynamics, and market psychology. The market is left to its own devices, with price movements being driven by liquidity hunts (triggering stop-loss orders above or below the range) rather than reactions to new information. This environment can be classified as neutral because it maintains the status quo, but it carries a bearish skew. Without positive catalysts to fuel a reversal, the path of least resistance often aligns with the preceding, technically-defined trend, which in this case is downward. The lack of news prevents new capital from being drawn to the asset, leaving the existing participants to dictate the direction of the eventual range break.
Scenario A: The Bearish Continuation
The primary scenario, which aligns with the preceding downtrend, involves a breakdown from the current consolidation range. This would occur if sellers re-assert control and push the price decisively below the established support floor, marked by the swing low around 56.61. A 4-hour candle closing firmly below this level would serve as the initial confirmation. Such a move would likely trigger a cascade of stop-loss orders placed by participants who bought within the range, adding fuel to the selling pressure. The breakout should be accompanied by a significant expansion in sell-side volume and a widening of the Bollinger Bands to the downside, confirming market conviction behind the move. This would invalidate the idea that the range was an accumulation phase and confirm it as a distribution or continuation pattern, opening the door for a new leg down toward unexplored price levels.
Scenario B: The Accumulation and Reversal
The alternative scenario is that the prolonged consolidation represents a phase of quiet accumulation by larger market participants. In this bullish case, the market would invalidate the bearish bias by engineering a breakout above the range's resistance. This would require a strong impulse move that pushes price above the 70-75 resistance zone, with a 4-hour candle closing confidently above it. This action would likely create a "short squeeze," where participants betting on a downside move are forced to buy back their positions to cover, accelerating the upward momentum. For this scenario to be considered valid, the breakout must be supported by a substantial surge in buy-side volume, indicating genuine demand is entering the market. A successful breakout would see the EMAs begin to slope upwards and the RSI break above the 60 level, signaling a definitive shift in momentum. This would turn the market structure from bearish to at least short-term bullish, with the price likely targeting the inefficiently priced zones left during the initial November decline.
What to Watch Next:
1. Volume Expansion: The single most important confirmation signal will be volume. The current low-volume environment is indicative of indecision. Any breakout, whether up or down, that is not supported by a volume spike significantly above the recent average is highly suspect and has an increased probability of being a "fakeout" or liquidity grab.
2. Price Action at Range Boundaries: Pay close attention to how the price behaves at the edges of the consolidation range (support around 56.61 and resistance around 70-75). A sharp rejection with a long wick from either boundary suggests the range will continue, while a clean break and retest would provide stronger confirmation of a new trend.
3. Momentum Confirmation: Watch for the RSI to break decisively away from the 50 level. A move below 40 would add weight to the bearish scenario, while a sustained break above 60 would lend credence to the bullish reversal case. The direction of the break will likely foreshadow the direction of the subsequent trend.
Risk Note:
This content is for informational purposes only and should not be construed as financial advice. The cryptocurrency market is subject to high volatility and risk. All participants should conduct their own thorough research and risk assessment before engaging in any trading or investment activities.
The market for GIGGLE is at a critical inflection point, and patience remains a key virtue for observers.