After a period of significant price discovery, Solana has entered a phase of quiet consolidation, leaving traders and investors in a state of anticipation. The market is currently defined by a tightening range and diminishing volatility, a classic technical setup that often precedes a powerful and decisive directional move. This compression suggests that energy is building within the market structure, and a volatility expansion may be imminent. Understanding the current price action, in the absence of fundamental catalysts, is paramount for navigating what comes next for SOL.
Market Snapshot:
SOL is currently trading within a well-defined horizontal channel, exhibiting characteristics of market equilibrium. Price action has been oscillating between established support and resistance levels for an extended period. This sideways movement indicates that neither the bullish nor bearish camp has managed to assert definitive control, leading to a period of balance where order books are being built on both sides of the current range.
Chart Read:
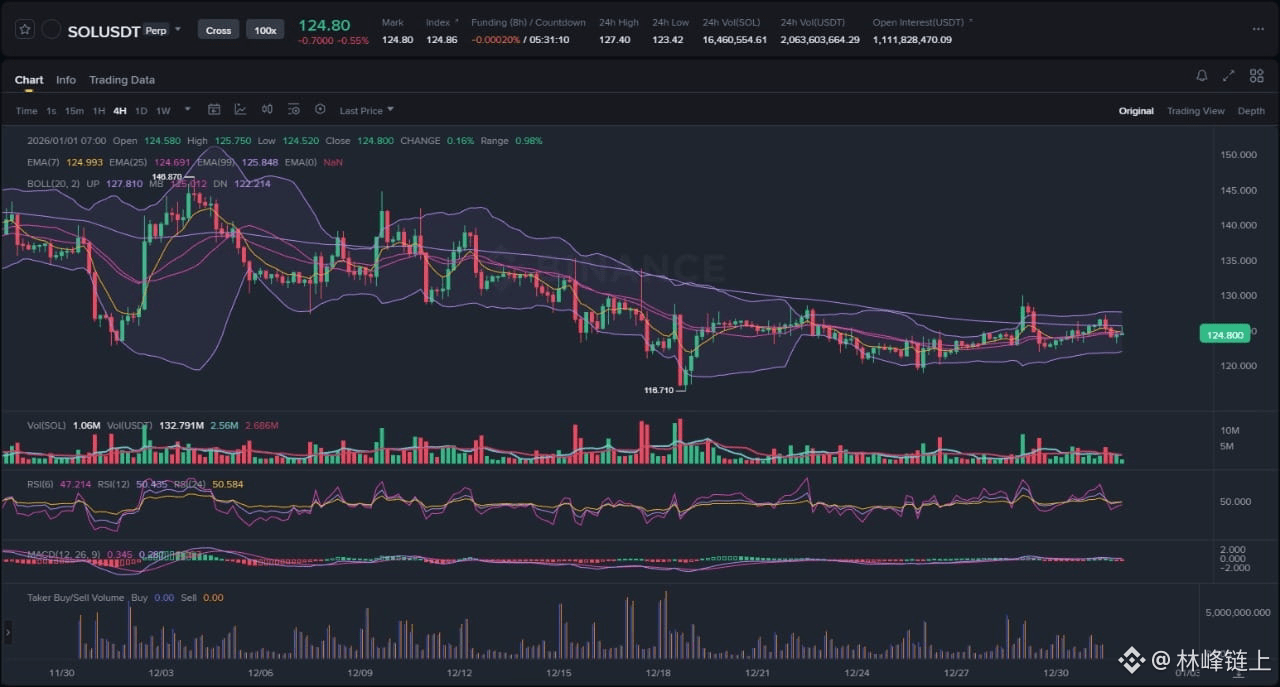
The 4-hour chart reveals a clear picture of volatility contraction. The Bollinger Bands, a key measure of volatility, are squeezing tightly. This is a technical signal that often precedes a significant price move, as periods of low volatility are frequently followed by periods of high volatility. Price action is contained within a range bound by the local swing low near the 118.710 level and a persistent resistance zone around the 128-130 area.
Furthermore, the key exponential moving averages (EMAs) are flattening and converging around the price, reinforcing the lack of a directional trend and highlighting the market's current state of indecision. Momentum oscillators like the Relative Strength Index (RSI) are hovering near the 50 midline, a textbook sign of neutrality. This entire structure is best described as a consolidation phase. Such phases can represent either accumulation by buyers preparing for a move up, or distribution by sellers offloading positions before a move down. Given this ambiguity, the main bias remains neutral until a confirmed break of the established range occurs.
News Drivers:
In a notable departure from a catalyst-rich environment, the recent price action has transpired in a relative vacuum of major, project-specific news for Solana. This absence of fundamental drivers gives rise to two primary themes influencing the market.
First is the emergence of a purely technical market (Neutral). Without new information to drive a narrative, price becomes a function of existing order flow, liquidity pockets, and established chart patterns. In this environment, technical analysis becomes exceptionally relevant as market participants react to levels rather than headlines.
Second is a heightened macro correlation (Mixed). In the absence of its own narrative, an asset like SOL often becomes more susceptible to the directional movements of market leaders, particularly BTC, and the broader sentiment driven by macroeconomic data and events. This makes SOL's trajectory partially dependent on external forces, which could provide either a tailwind or a headwind.
Scenario A: Bullish Range Resolution
The primary bullish scenario requires a decisive breakout above the upper boundary of the consolidation range, specifically the resistance zone near 128-130. For this move to be considered valid, it would need to be accompanied by a significant expansion in trading volume, which would signal strong buying conviction and participation. A successful breakout would likely see the price push higher, with the former resistance level then flipping to become a new floor of support. A subsequent retest of this level that holds firm would be a strong confirmation that the consolidation period was an accumulation phase, potentially setting the stage for a continuation of the prior uptrend.
Scenario B: Bearish Invalidation and Breakdown
The alternative scenario involves a failure to breach the range resistance, followed by a breakdown below the key support level holding near 118.710. Such a move would invalidate the neutral-to-bullish outlook and suggest that sellers have taken control. For this scenario to be confirmed, the breakdown must occur on elevated sell-side volume, indicating that the preceding range was a period of distribution. A subsequent attempt to reclaim the broken support level that results in a sharp rejection would solidify bearish control and open the possibility of a deeper price correction toward lower liquidity zones.
What to Watch Next:
Market participants should closely monitor a few key indicators for early clues on the next directional move.
1. Volume Expansion: Any break of the range on low volume is highly suspect and carries an increased risk of being a fakeout or a liquidity sweep designed to trap traders. A confirmed move must have a surge in volume behind it.
2. Bollinger Band Squeeze Break: The direction in which price breaks out of the current Bollinger Band squeeze will be a critical, and often early, signal of impending volatility and short-term trend.
3. Reaction at Range Extremes: Pay close attention to how price behaves at the upper and lower boundaries of the current range. A strong, decisive defense of support or a sharp, immediate rejection from resistance provides valuable insight into the underlying order flow and market sentiment.
Risk Note:
This analysis is for informational purposes only and does not constitute financial advice. The cryptocurrency market is subject to high volatility and unpredictable price movements. All participants should conduct their own thorough research and implement robust risk management strategies before engaging with the market.
The technical structure is clear; the market now awaits a catalyst or a decisive move from large participants to resolve the current equilibrium.