The cryptocurrency market has opened 2026 with renewed volatility, and Dogecoin (DOGE) has emerged as a primary focal point for speculative capital. After weeks of suppressed price action and a persistent downtrend that characterized the closing month of 2025, the leading meme asset has initiated a sharp, impulsive recovery. The attached technical chart reveals a significant shift in market structure, transitioning from a distribution phase into an aggressive accumulation and markup phase. This analysis dissects the confluence of technical indicators visible on the 4-hour timeframe, integrates the latest developments in the derivatives market, and outlines high-probability scenarios for the coming sessions.
Market Snapshot
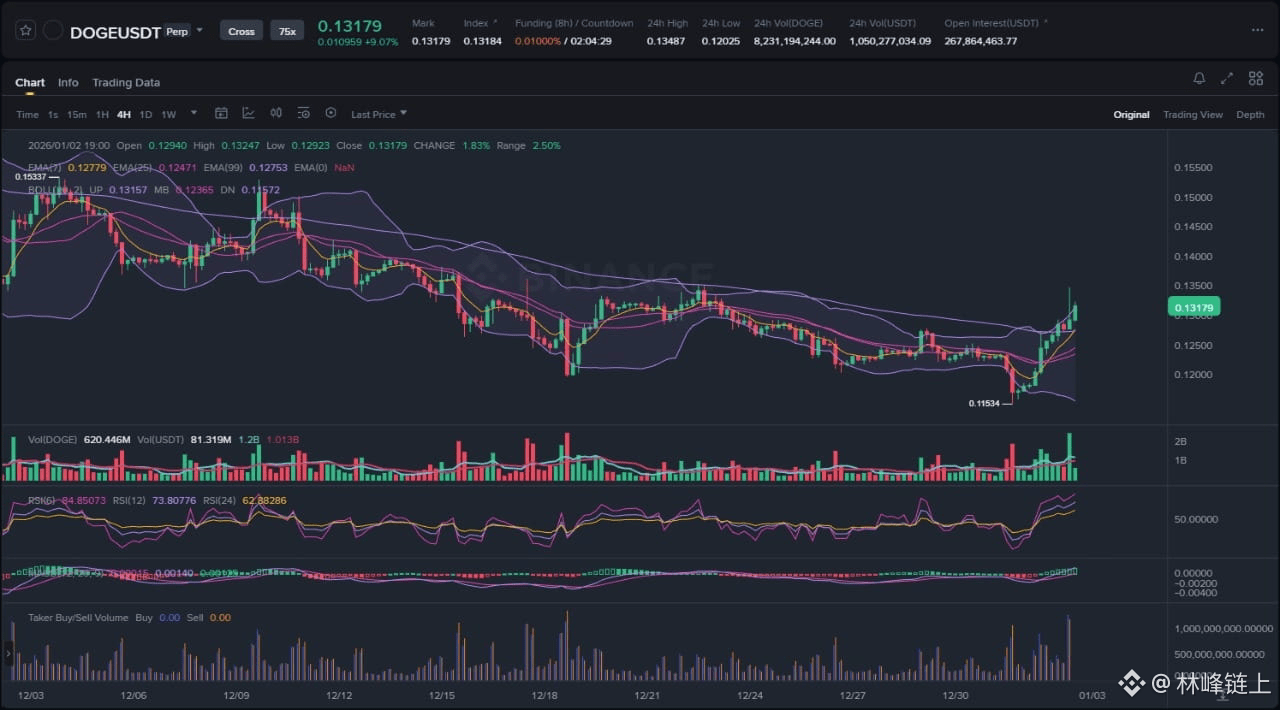
At the time of this analysis, DOGE is trading near 0.13179, marking a significant departure from the recent lows of 0.11534 established just days prior. The price action represents a classic V-shaped recovery, a pattern often associated with a capitulation event followed by a rapid influx of buy-side liquidity. The broader market context suggests a rotation of capital into high-beta assets, with DOGE leading the charge among legacy meme coins. The immediate sentiment has shifted from fear to cautious optimism, driven by a combination of technical reclamation and a resurgence in futures market activity.
Chart Read
The provided 4-hour chart offers a granular view of the recent structural shift. Several technical developments warrant close attention.
First, the Market Structure Shift is undeniable. For the majority of the visible period, DOGE was trapped in a lower-high, lower-low structure, guided downward by the short-term Exponential Moving Averages (EMAs). The break of the 0.11534 level served as a liquidity sweep—a move designed to trigger stop-losses below the previous range support. Once this liquidity was absorbed, the price reversed aggressively. The current candle structure has successfully broken the sequence of lower highs, signaling a potential trend reversal rather than a mere relief bounce.
Second, the Bollinger Band interaction is critical. The chart shows a period of low volatility where the bands contracted significantly (a squeeze) prior to the breakdown to 0.115. However, the subsequent reversal has pushed the price well above the Upper Bollinger Band. This is a signal of extreme strength and volatility expansion. While riding the upper band is a bullish signal, it also statistically increases the probability of a mean reversion, where price pulls back to test the midline or the upper band support to normalize the momentum.
Third, the Moving Average convergence is providing dynamic support. The price has impulsively reclaimed the 7-period and 25-period EMAs. More importantly, the price action is currently challenging the 99-period EMA (the purple line). A confirmed 4-hour close above this long-term moving average would serve as a macro signal that the intermediate trend has shifted from bearish to bullish.
Finally, the Volume and RSI profile supports the move. The Relative Strength Index (RSI) has surged from oversold conditions directly into overbought territory. While an overbought RSI can signal a local top, in strong trending moves, the RSI can remain elevated for extended periods. The accompanying volume bars show a distinct increase in buying pressure relative to the selling volume seen during the descent, validating the legitimacy of the price increase.
News Drivers
Recent developments in the news cycle provide the fundamental and sentimental backdrop for the technical moves observed on the chart. Three key themes have emerged from the latest headlines.
The first theme is the resurgence of speculative appetite in the derivatives market. Reports indicate that DOGE has seen a massive surge in volume, clocking in at over 13.58 billion DOGE in a 24-hour period. This spike is largely attributed to the futures market. High activity in futures often precedes increased volatility. In this context, the rapid price increase suggests a "short squeeze" scenario where late shorters were forced to cover their positions as the price rebounded from 0.115, adding fuel to the rally. This aligns perfectly with the impulsive green candles seen on the chart.
The second theme revolves around ambitious price targets and technical optimism. Analysts are projecting targets of $0.17 and potentially $0.20 in the first quarter of 2026. These predictions are based on the completion of the correction phase and the initiation of a new impulsive wave. The $0.17 target specifically aligns with previous structural resistance levels that would need to be tested if the current reversal holds.
The third theme is the identification of a macro bottom. The narrative suggests that the recent dip was the first major rebound opportunity of 2026. The sentiment here is overwhelmingly bullish, positioning the recent lows as a definitive bottom.
When juxtaposing these news items with the chart, there is a strong correlation. The "futures surge" explains the velocity of the move up. However, traders must remain cautious. When news outlets unanimously declare a bottom and project targets 30-50% higher, the market often seeks to flush out over-leveraged longs before fulfilling those targets. The news is bullish, but the crowd sentiment creates a contrarian risk of a local pullback.
Scenario A: Bullish Continuation
For the bullish bias to remain valid and for the price to approach the $0.17 targets mentioned in the news, specific technical criteria must be met. The primary requirement is the successful flipping of the 99-period EMA into support. Currently, the price is testing this level. A clean breakout above the 0.132–0.135 zone is essential.
In this scenario, we would expect to see the price consolidate briefly above 0.130, allowing the lower timeframe indicators to cool off. Following this consolidation, a continuation move would likely target the liquidity pockets residing at 0.145 and 0.150. These levels represent the previous breakdown points where trapped buyers may look to exit at breakeven. If the buying volume sustains, the price could extend toward the $0.17 target by February, as predicted. The key to this scenario is the 7-period EMA; as long as the 4-hour candles close above this fast-moving average, the momentum trade remains active.
Scenario B: Bearish Rejection and Range Re-entry
The alternative scenario considers the possibility that the current move is a "bull trap" or a complex correction within a larger downtrend. The invalidation of the bullish thesis would occur if the price faces a hard rejection at the current level (0.132) and fails to hold the 0.125 support zone.
If the price falls back below the middle Bollinger Band and loses the 25-period EMA, it would suggest that the move up was merely a liquidity grab to fill short orders at a better price. In this case, the market would likely seek to retest the demand zone. A failure to hold 0.125 would open the path for a full retrace to the 0.115 lows. Furthermore, if the futures open interest remains historically high while price stalls, it could indicate a distribution phase where smart money is offloading spot bags to late leverage traders, leading to a sharp liquidation wick to the downside.
What to Watch Next
Traders and analysts should focus on three specific data points in the upcoming sessions.
First, observe the reaction at the 0.135 resistance cluster. This is a local swing high that aligns with the 99 EMA. A high-volume rejection here with a long upper wick would be a bearish signal, while a full-body candle close through it would confirm strength.
Second, monitor the volume profile during pullbacks. In a healthy uptrend, pullbacks should be accompanied by declining volume. If selling volume spikes during a dip, it indicates that bears are regaining control.
Third, keep an eye on the funding rates in the futures market. Given the news of a surge in futures activity, highly positive funding rates would suggest the market is over-leveraged to the long side, increasing the risk of a "long squeeze" or flush to the downside before any further upside.
Risk Note
Cryptocurrency trading involves substantial risk, particularly with assets like Dogecoin that are heavily influenced by social sentiment and derivatives leverage. The current volatility expansion increases the likelihood of slippage and rapid price changes. Market participants should utilize risk management strategies, such as stop-losses and proper position sizing, and be aware that technical patterns can fail in the face of macro-economic shifts or sudden liquidity events.
The convergence of a technical breakout and rising futures volume suggests DOGE is at a critical decision point for the first quarter of 2026.