Solana (SOL) stands at a critical juncture where technical resilience aligns with mounting positive catalysts, potentially setting the stage for renewed upside momentum in a volatile crypto landscape. As traders eye key resistance levels amid broader market rotations, the interplay between price action and recent developments offers probabilistic insights into near-term trajectories, without guaranteeing outcomes.
Market Snapshot:
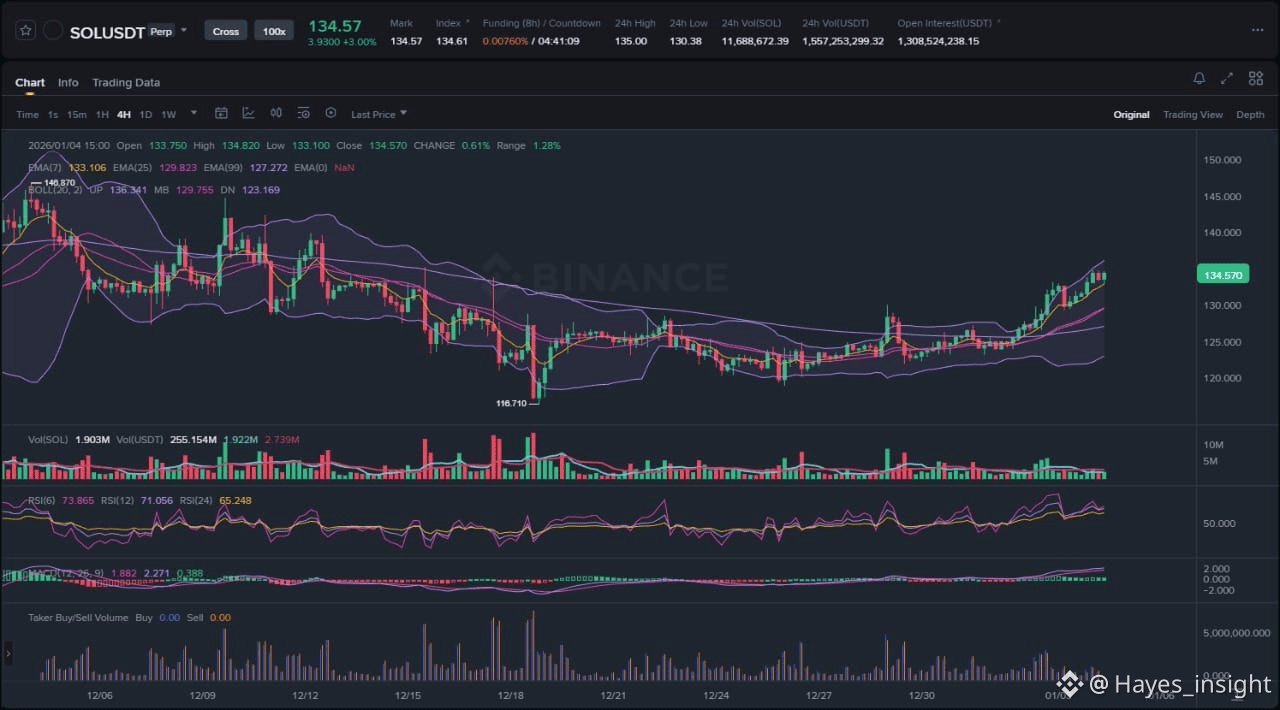
The SOL/USD chart on Binance reveals a clear uptrend structure over the observed timeframe, characterized by higher swing highs and higher swing lows since the most recent local bottom. Price has respected an ascending channel, with the lower boundary acting as dynamic support during pullbacks. Currently trading around $135, SOL exhibits consolidation just below a multi-week resistance zone, following an impulsive rally that expanded volatility and broke prior local highs. Observable elements include a bullish engulfing candle at the channel low, rejection wicks at overhead supply, and contracting Bollinger Bands signaling impending volatility expansion. The main bias remains bullish, driven by the preserved uptrend integrity and bullish divergence on the RSI oscillator, where momentum troughs are higher despite price retests of support. This setup suggests accumulation rather than distribution, with liquidity pockets building below recent lows.
Chart Read:
Diving deeper into the price action, SOL's structure shows a textbook higher low formation after tagging the channel's lower trendline near $130, accompanied by a spike in volume that confirmed buyer conviction. The 4-hour candles display successive hammers and dojis at key support, rejecting lower prices and forming a potential bull flag pattern within the broader uptrend. Mean reversion appears contained within the channel, with no breakdown below the 50-period EMA, which now slopes upward as confluence support. Local swing highs near $135 have capped advances, creating a tight range that could resolve higher if sellers exhaust. Volatility has moderated post-rally, with ATR contracting, often preceding breakout moves. Overall, the chart's bullish bias holds as long as the channel remains intact, pointing to potential retest of prior highs if momentum builds.
News Drivers:
Recent headlines cluster around three bullish themes for SOL, amplifying the chart's positive lean without evident conflict. First, project-specific upgrades dominate, with Bitcoinist highlighting Solana's impending network upgrade as a pivotal evolution, emphasizing its speed and low fees after years of technical maturation—this is unequivocally bullish, as enhanced infrastructure could attract more dApps and liquidity. Second, price prediction and technical momentum form a macro-market theme, per Blockchain News forecasting a $146-150 breakout within two weeks if $130 support holds, aligning seamlessly with the chart's resistance test and building bullish sentiment. Third, long-term millionaire-maker potential underscores fundamental strength, as The Motley Fool praises Solana's proof-of-stake network and superior technical infrastructure versus peers—bullish on adoption and scarcity narratives. All themes are bullish, reinforcing accumulation dynamics rather than sell-the-news pressure, with no bearish counterpoints diluting the narrative.
The synergy between news and chart is notable: upbeat upgrade anticipation coincides with consolidation near resistance, potentially fueling a liquidity sweep above $135 to trap shorts. Unlike scenarios where positive news meets fading price (signaling distribution), SOL's hold above channel support suggests genuine demand absorption. Probabilistic upside stems from these catalysts converging on a structurally sound chart, though broader crypto liquidity will influence execution.
Scenarios:
For bullish continuation, SOL must first reclaim the range top near recent swing highs with conviction—ideally a strong close above $135 on elevated volume, followed by an impulsive breakout from the bull flag. This would target the channel's upper boundary and prior all-time resistance, confirming momentum resumption and invalidating any range-bound narrative. Sustained support above the $130 channel low during pullbacks would further validate, allowing mean reversion plays within the uptrend.
Alternatively, invalidation occurs on a breakdown below the channel low and 50-EMA confluence near $130, potentially forming a lower low and shifting bias to neutral or bearish. This fakeout scenario might involve a liquidity grab sweeping recent lows to trigger stops, followed by rejection higher—but failure to rebound quickly could signal distribution phase entry, targeting the prior swing low. A range expansion lower with volume divergence would heighten breakdown risks, especially if news-driven euphoria fades.
In probabilistic terms, continuation holds higher odds given the chart's resilience and news tailwinds, but traders must monitor for structural shifts.
What to Watch Next:
1. Volume profile at $135 resistance: Expanding buy volume on breakout attempts signals genuine momentum, while fading volume suggests rejection and range extension.
2. Reaction to $130 support: A clean bounce with bullish candle confirmation reinforces the uptrend; penetration invites liquidity sweeps and tests lower channel extensions.
3. RSI momentum and MACD histogram: Bullish crossover above 60 on RSI or histogram expansion targets upside acceleration; divergence warns of exhaustion.
4. Broader market spillovers: BTC dominance retreat or ETH outperformance could provide tailwinds, amplifying SOL's relative strength.
Risk Note:
While setups appear constructive, crypto markets are prone to rapid reversals from liquidity imbalances, macroeconomic shocks, or network hiccups—position sizing and stop discipline remain paramount in navigating probabilistic outcomes.
Solana's confluence of technical strength and positive news positions it for potential outperformance, warranting vigilant monitoring.