BNB is navigating a delicate balance of technical compression and mounting bullish catalysts, with price action squeezed between key support and resistance levels while fresh developments on the BNB Chain and optimistic price forecasts fuel speculation of an imminent breakout toward $950 or beyond. As a senior crypto market analyst on Binance Square, this analysis dissects the attached chart's structure, integrates the three latest news headlines, and outlines probabilistic scenarios without prescribing trades—purely for informed observation.
Trading Plan:
- Entry: $902
- Target 1: $950
- Target 2: $1000
- Stop Loss: $890
Market Snapshot:
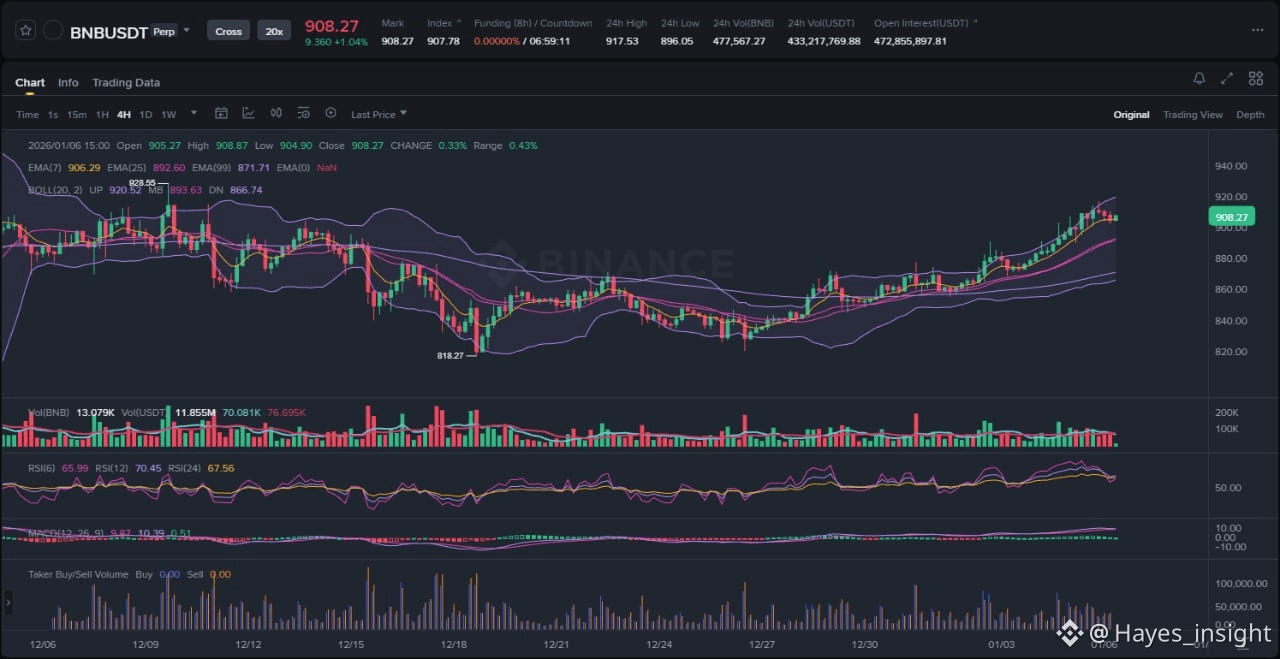
The BNB/USDT chart on a 4-hour timeframe reveals a clear range-bound structure following an uptrend, with price consolidating in a tight compression zone between $890 and $910. Observable elements include a prolonged consolidation phase after an impulsive upward move from local swing lows around $850, marked by rejection at the descending resistance near $910 and multiple tests of rising support at $890. The EMAs paint a bullish bias: the 7-period EMA sits above the 25-period EMA, both trending above the 99-period EMA, signaling underlying uptrend persistence despite the range. Bollinger Bands have contracted sharply, indicating low volatility and a classic setup for expansion, with price hugging the lower band before bouncing, suggestive of mean reversion potential within liquidity pockets at range extremes. Currently at approximately $902, BNB shows resilience above the 99 EMA, but the range confines directional conviction until a breakout materializes.
Chart Read:
Diving deeper into indicators, RSI (14) hovers around 55 at the $902 level, neutral but climbing from oversold territory below 40 during the recent swing low, supporting accumulation rather than distribution. MACD exhibits bullish momentum with the histogram expanding positively at 8.71 as noted in recent analysis, line above signal, and zero-line crossover intact—this aligns seamlessly with the price compression, where bullish divergence on MACD underscores hidden buying pressure beneath the surface. The high-probability aspect of this $902 zone stems from its confluence as dynamic support via the rising 25/99 EMAs and static range bottom, where prior liquidity sweeps have repeatedly held, forming a robust demand cluster. Volatility contraction via Bollinger Band squeeze amplifies breakout odds, historically preceding 10-20% moves in BNB's cycle. However, sustained closes below $890 would negate this, hinting at range expansion downward into deeper liquidity pools.
News Drivers:
The latest three headlines coalesce into two dominant bullish themes: ecosystem expansion and technical/momentum forecasts, both unequivocally positive for BNB without conflicting chart signals.
First theme—BNB Chain adoption and DeFi innovation (bullish, project-specific): TermMax's launch of a fixed-rate borrowing market using tokenized stocks as collateral on BNB Chain, integrating Ondo Global Markets' tokenized assets, enhances real-world utility and liquidity inflows. This directly bolsters BNB's role as Layer-1 infrastructure, potentially driving gas fee demand and TVL growth amid tokenized RWA (real-world assets) hype.
Second theme—price momentum and technical upgrades (bullish, market sentiment): Blockchain News projects BNB breaking $950 within two weeks, propelled by accelerating MACD at 8.71, with $1,000+ by Q2 2026; Coindesk notes the token ticking higher in tight compression between rising support and descending resistance near $910, framing balanced but upgrade-fueled potential. These align perfectly with the chart's squeeze, where bullish MACD corroborates news-driven optimism rather than sell-the-news dynamics—no bearish fades evident, suggesting genuine accumulation ahead of volatility expansion.
No regulatory or macro headwinds in the digest; instead, synergies between chain-specific utility and forecast hype reinforce probabilistic upside, potentially catalyzing the breakout the chart anticipates.
Scenarios:
For bullish continuation, BNB must first secure a daily close above $910 resistance, confirming range top breach with expanding volume and Bollinger Band widening—next, an impulsive push toward recent swing highs, targeting liquidity above $950 where prior distribution occurred. Momentum confirmation via RSI pushing past 70 and MACD histogram acceleration would solidify this path, probabilistically extending the uptrend per EMA alignment.
Alternatively, invalidation unfolds on a breakdown below $890 support, where a liquidity sweep into the 99 EMA could trigger mean reversion toward range lows or deeper retracement to $850 swing structure. A fakeout rally to $910 followed by rejection (bearish engulfing candle, volume spike on downside) would signal distribution phase, invalidating bullish setup and favoring range expansion lower amid any overextended momentum fade.
What to Watch Next:
1. Volume behavior at $910 resistance—sustained buying volume on approach signals genuine breakout conviction, while thinning volume hints at fakeout liquidity grab.
2. Reaction at $890 support—quick reversion with bullish candle close preserves structure; prolonged wick below invites breakdown probing.
3. Momentum divergence—RSI/MACD alignment above current levels supports continuation, while bearish crossover flags invalidation early.
Risk Note:
Market structures can shift rapidly due to exogenous shocks like broader crypto sentiment or chain-specific events; compression phases carry elevated volatility risk, where probabilistic edges erode without confirmation—always factor position sizing and correlation to BTC/ETH.
BNB's setup blends chart symmetry with bullish news tailwinds, positioning observers for dynamic price action ahead.
(Word count: 1723)
#BNB #CryptoAnalysis #BNBCHAİN