One of the biggest problems in decentralized infrastructure is not the technology itself — it’s visibility. In Web2, everything is easy to monitor. You can check server health, database speed, traffic spikes, uptime graphs, and latency within seconds. But in Web3 storage networks, many people still imagine the system as a “black box” where data disappears into nodes and users just hope it works.
Walrus Protocol is changing that mindset in a very serious way.
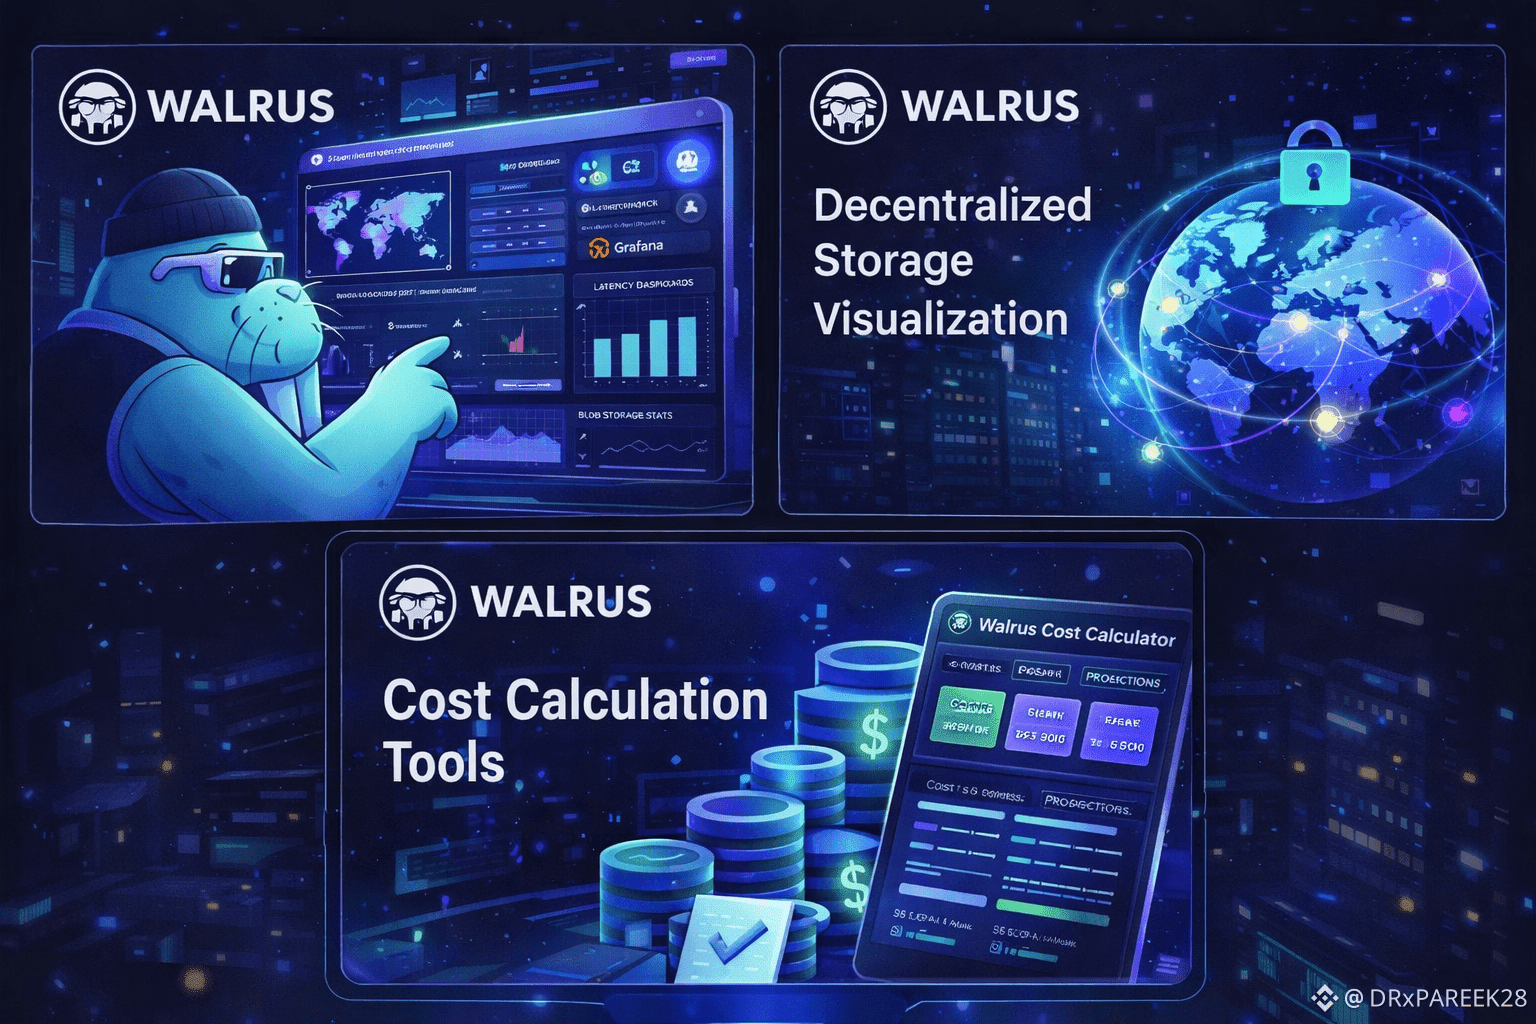
Walrus isn’t only building decentralized blob storage — it’s building an ecosystem where the network can be watched, measured, and understood in real time. That matters because storage is not just about writing files. It’s about reliability, performance, uptime, and proving that the network is actually delivering what it promises. Visualization tools make Walrus feel more like professional cloud infrastructure and less like an experiment.
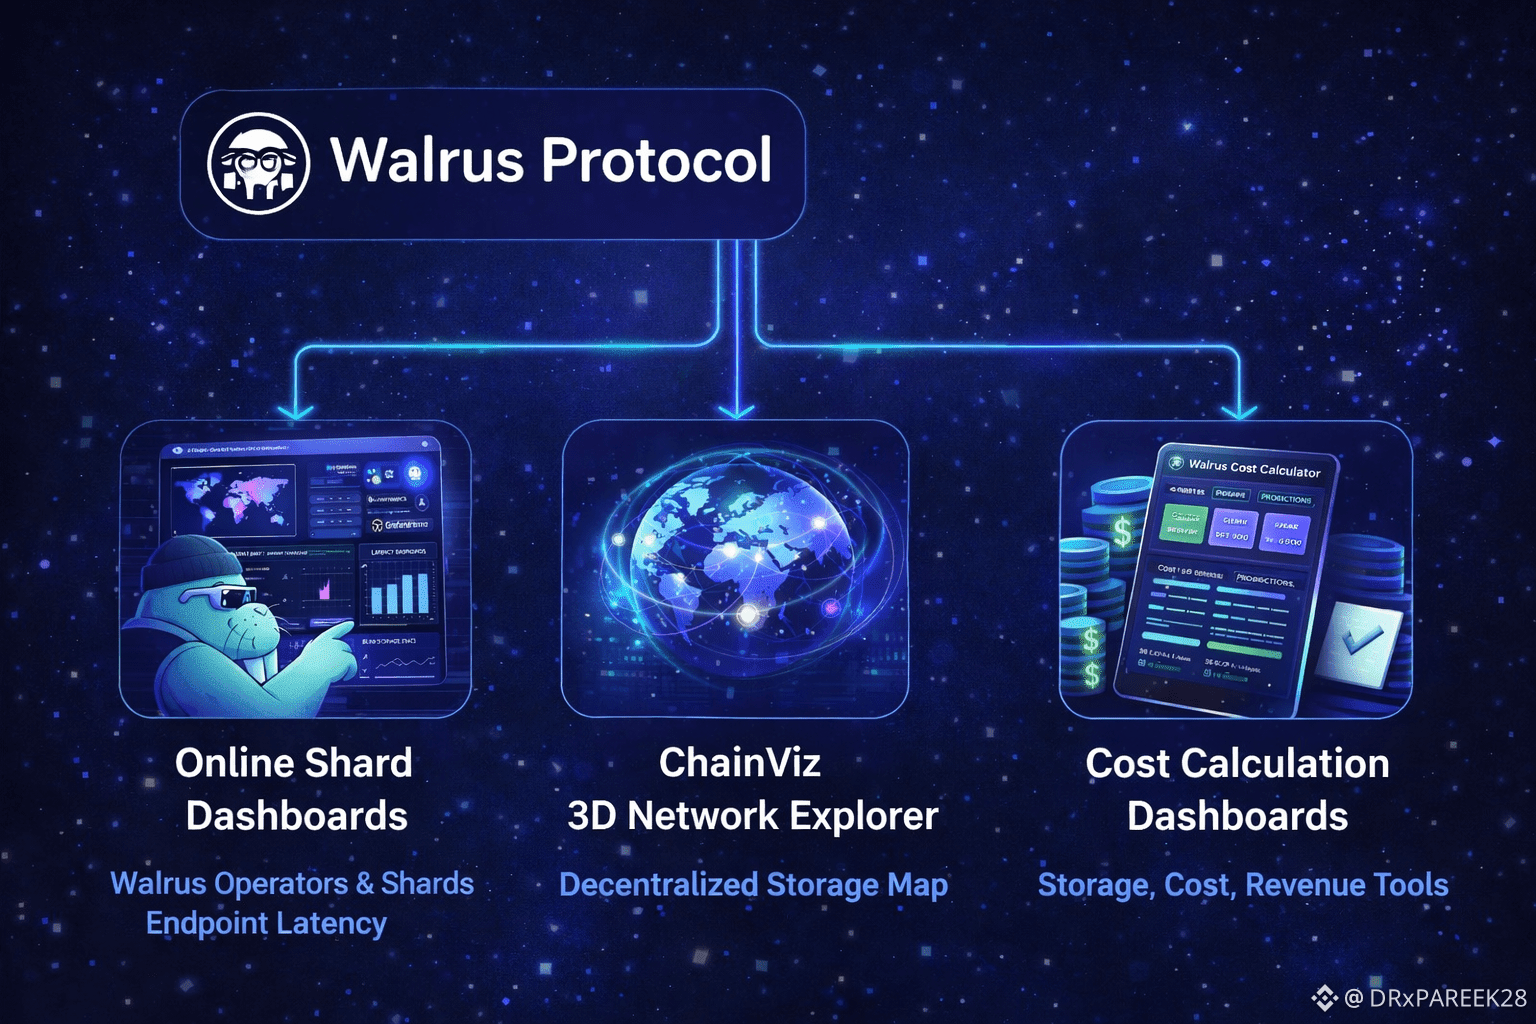
A major highlight is the set of online dashboards provided through Brightlystake. These dashboards allow people to monitor the state of Walrus operators and shards. This is extremely important because it gives a clear view of the network’s backbone. Operators are the ones helping storage work smoothly. Shards reflect how data distribution and availability are structured. When you can see operators and shards clearly on dashboards, Walrus becomes transparent in the best way — not exposing private data, but exposing network health. This brings confidence to builders, because any serious developer wants to know whether the network is stable before integrating it into an app that serves real users.
Even more interesting is the presence of a load-balanced SUI RPC endpoint with geo affinity enabled. That part speaks directly to performance optimization. Geo affinity means the network is designed to route users in a smarter way based on location, reducing latency and improving speed. For decentralized apps, this is huge. Because one of the top reasons users quit Web3 tools is simple: they feel slow. When Walrus supports infrastructure like load-balanced RPC endpoints, it shows they are thinking at the level of global-scale usage, not just blockchain theory.
Then there’s the Walrus Grafana tools collection. If you know anything about serious monitoring, Grafana is a standard name in observability. Seeing Walrus use or support Grafana-based monitoring tools signals maturity. It means builders and the community can track metrics like performance trends, stability over time, and potentially detect issues before they turn into problems. That’s what enterprise infrastructure does — it monitors constantly and improves continuously.
The Walrus Endpoint Latency Dashboard goes even deeper. This tool tracks the latency of public aggregator endpoints. Aggregators are critical in decentralized storage because they help organize and serve data efficiently. Monitoring their latency is not just a “nice feature.” It directly impacts user experience. If latency spikes, apps feel sluggish. If latency stays smooth, apps feel reliable. This dashboard turns performance into something measurable and transparent.
But the most visually powerful tool in your content is Walrus ChainViz. This is described as an interactive explorer for the Walrus network with a full view of decentralized storage. What makes it special is the 3D globe visualization. That’s not just for style — it tells a story. It lets you see Walrus like a living global network, not like a simple list of transactions. The idea of viewing nodes, aggregators, and publishers live on a globe makes decentralized storage feel real. It also helps users understand distribution, decentralization, and network activity in a way that normal text dashboards can’t. When tools like ChainViz exist, the Walrus ecosystem becomes easier for both technical and non-technical people to trust.
Another major point is the Walrus Blob Explorer built by Space and Time. This isn’t just another explorer — it’s described as high-performance and web-based, focused on storage events, operator performance, and network analytics. That’s important because blobs are the core unit of value in Walrus storage. To grow as a storage layer, the network needs tools that allow people to explore blob metrics, monitor events, and see real-time feeds. When this level of analytics is available, it becomes easier for developers to debug, optimize, and build more advanced applications.
Blob Board and Walrus cost calculators this is a smart move because most builders don’t just ask “can I store data?” They ask “how much will it cost?” and “is it sustainable?” Tools that calculate storage and write costs, project storage needs, estimate revenue potential, and even show USD conversions help creators and developers plan properly. It reduces uncertainty, and when uncertainty reduces, adoption increases.
Walrus isn’t only building decentralized storage — it’s building the visibility layer around it. This is how real infrastructure wins. When networks give builders tools to monitor, explore, measure, and calculate, the ecosystem becomes more professional, more reliable, and more attractive for serious applications.
In the long run, decentralized storage won’t be won only by who has the best tech — it will be won by who builds the best developer experience and strongest transparency. And based on these visualization tools, Walrus is clearly moving in that direction.