Right now, expectations around Bitcoin are extremely high. Retail sentiment is loud, emotional, and often driven by price targets rather than structure.
But the real story — the actual intent — is usually known only by large investors and long-term holders.
Most people ask one question:
👉 “Will BTC keep going up?”
A better question is:
👉 “What needs to happen before it goes higher?”
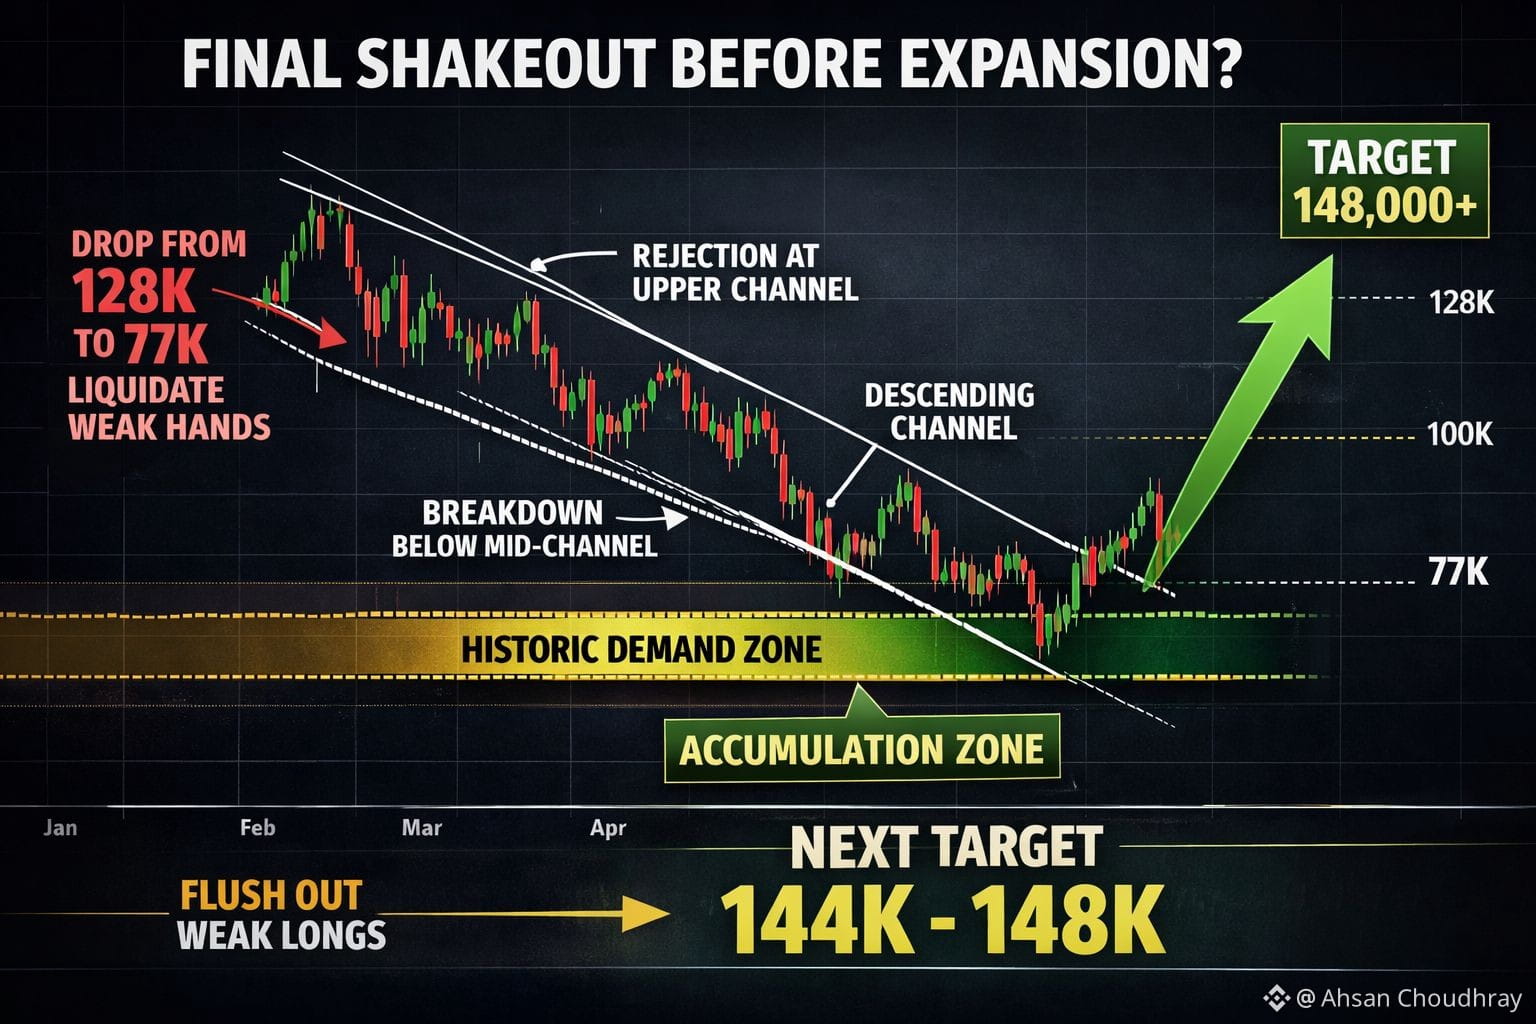
Imagine this scenario: Bitcoin once traded near 128K, then quietly retraced toward 70K.
For many, that sounds impossible.
For experienced market participants, it sounds… necessary.
Corrections are not punishments.
They are opportunities, especially for those who missed earlier entries.
Life gives chances again and again — markets do the same.
The difference is simple:
Do you act… or do you watch?
My Positioning: Early, Calm, and Patient
I am already building an early position from current levels, targeting the 148K region in the next expansion phase.
Not based on hype.
Not based on emotions.
But based on structure, liquidity behavior, and historical cycles.
When that level is reached, this won’t sound bold anymore — it will sound obvious.
What the Daily BTC Chart Is Really Saying
Bitcoin’s current price behavior on the daily timeframe is not chaotic.
It’s not emotional.
It’s mechanical.
This timeframe is where institutional behavior becomes visible.
Lower timeframes are dominated by leverage, panic, and noise.
The daily chart reflects capital rotation, accumulation, and strategic drawdowns.
Key observations from the current structure:
Price moving within a descending channel
Rejection from the upper channel boundary
Breakdown through mid-range support
Price approaching a historically reactive demand zone near 77K
Volatility expanding after a period of compression
None of this automatically signals a bear market.
In Bitcoin’s history, this exact combination often appears in the final stages of corrective phases during broader bull cycles.
Liquidity, Not Fear, Is Driving This Move
From a higher-timeframe perspective, the drop toward 77K looks less like trend failure and more like a calculated liquidity sweep.
What happened here?
Late buyers were flushed
Overleveraged longs were liquidated
Breakout traders were invalidated
Market positioning was reset
Yet price didn’t collapse into chaos.
It moved cleanly, structurally, and with intent.
That behavior usually signals distribution of fear and accumulation by stronger hands, not the end of a cycle.
The Pattern Bitcoin Always Repeats
Bitcoin has never entered a strong price-discovery phase without first creating maximum doubt.
This phase is doing exactly that:
Confidence is breaking
Sentiment is compressed
Leverage is being cleared
If history continues to rhyme, this period will later be remembered as:
Not the start of a bear market — but the final shakeout before expansion.
Final Thought
I’ve studied past cycles, and I’ll show those examples separately.
For now, the message is simple:
Take positions early.
Detach emotionally.
Give it time.
Forget the chart for a year — and come back when Bitcoin is knocking on 144K–148K.
Best of luck on your journey.
This is a #BullishJourney 🚀