Quick Stats:
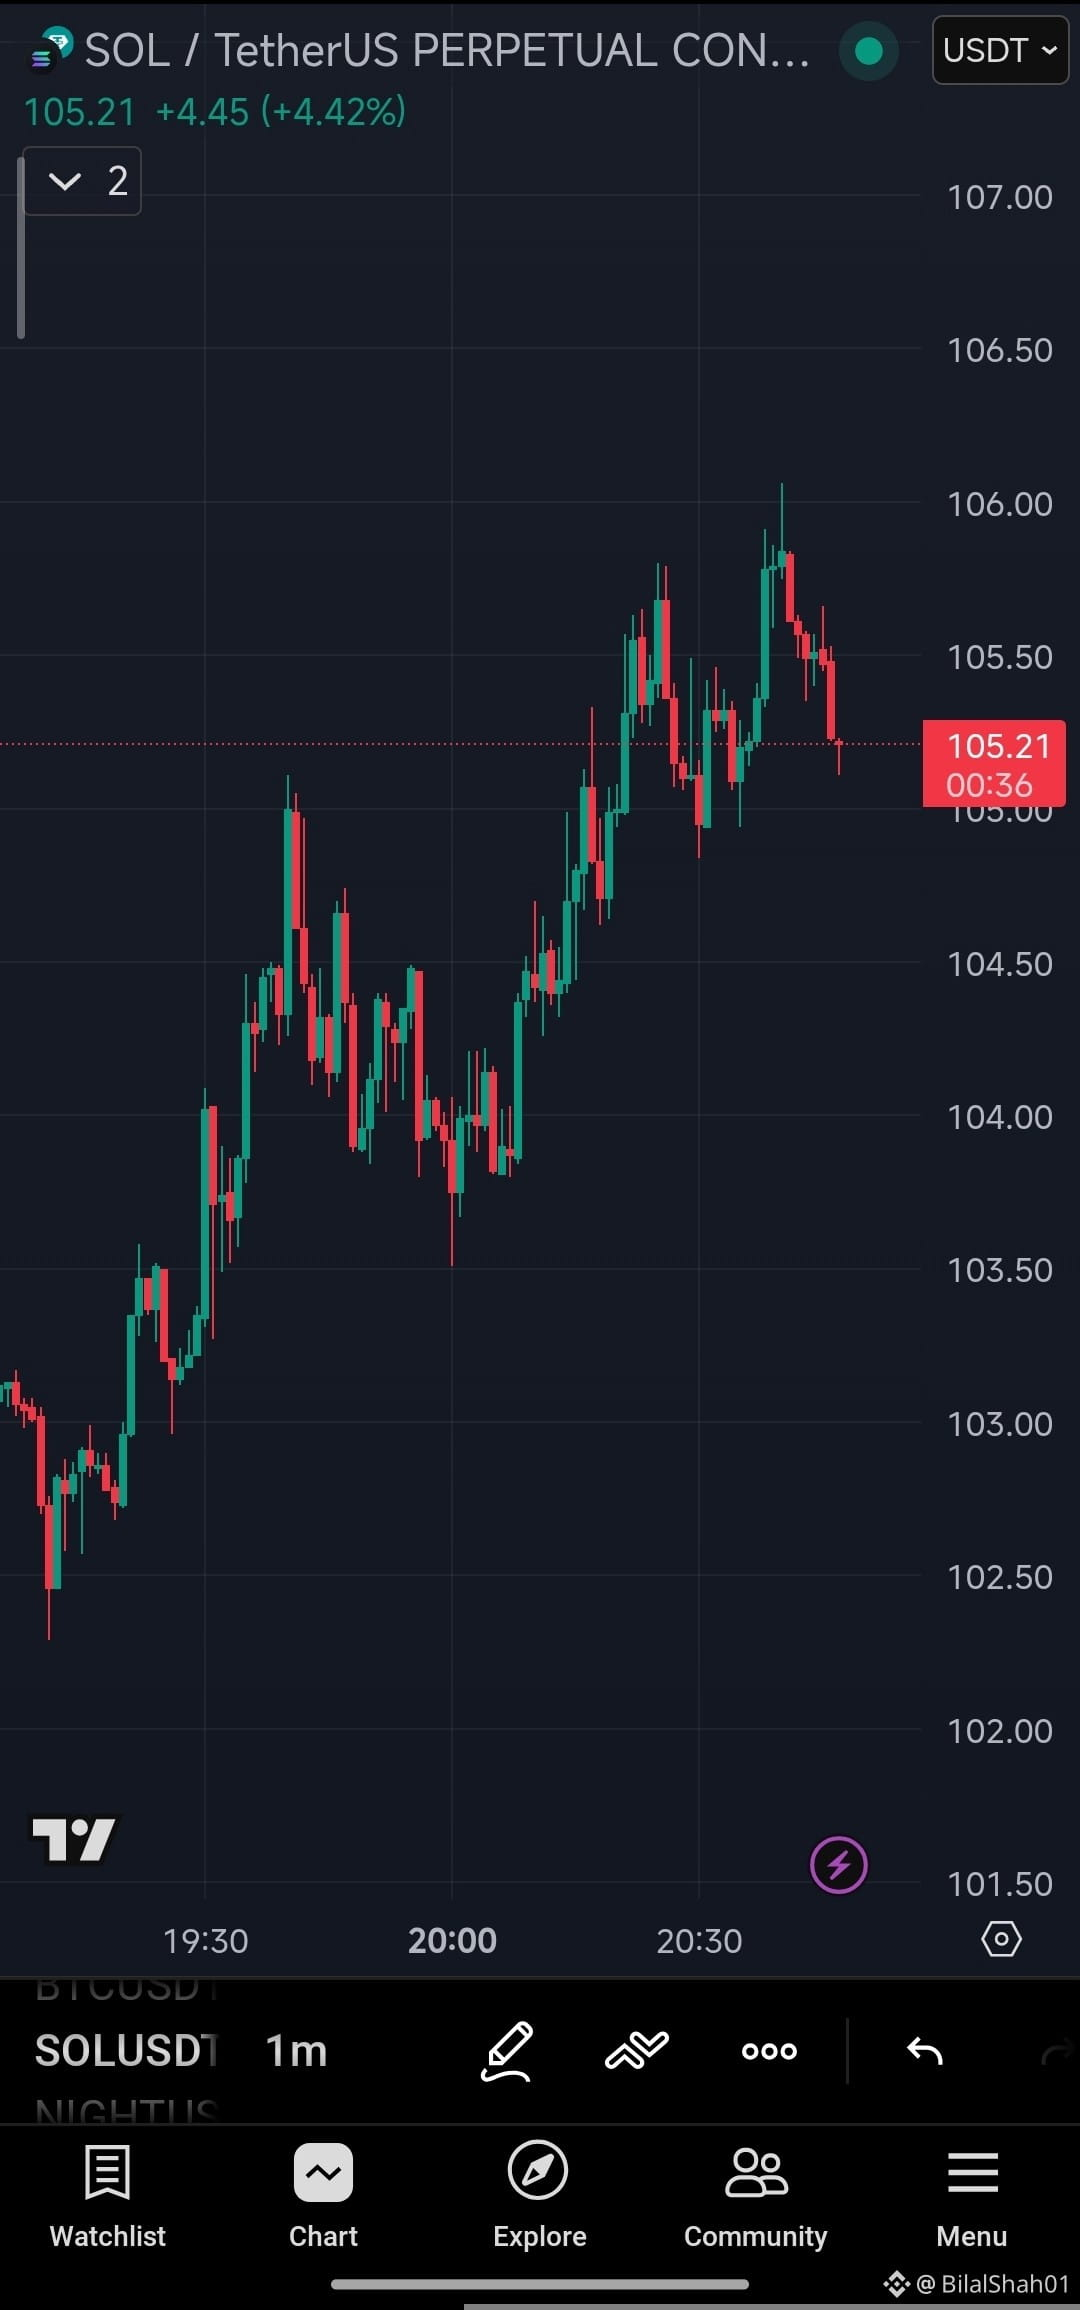
· Instrument: SOL/USDT Perpetual Contract
· Current Price: $105.21
· Hourly Change: +4.45 (+4.42%)
· Timeframe Observed: 1-Minute Chart
What’s Happening?
SOL is showing strong bullish momentum with a sharp +4.42% move in a short period, breaking past $105 and eyeing higher resistance levels.
Key Chart Observations 📈:
· Strong Upside Move: The 1-minute chart shows a rapid price ascent from around $102–$103 levels to $105+ in under an hour.
· Immediate Resistance: Watch for tests at $106.50** and **$107.00. A break above could signal further bullish momentum.
· Support Levels: In case of a pullback, $104.00** and **$103.50 are key support zones to monitor.
· Time of Move: Significant move observed between 19:30 to 00:36 UTC, indicating high intraday activity.
Market Sentiment & Possible Catalysts:
This surge could be driven by:
· Positive sentiment across the crypto market
· Strong fundamentals or network updates on Solana
· Trader positioning ahead of larger market moves
Trade Smart ⚠️:
· Crypto markets are highly volatile. Trade only with what you can afford to lose.
· Use stop-losses to manage risk, especially in fast-moving markets.
· Consider higher timeframes for confirmation before taking larger positions.
Engage With Us!
Do you think SOL will test $110 soon, or are we due for a correction? Drop your analysis, targets, and support/resistance levels in the comments! 👇
#Binance #BinanceSquare #SOL #Solana #Crypto #Trading #CryptoNews #Altcoins #PerpetualContracts #TechnicalAnalysis
---
Disclaimer: This post is for informational purposes only and not financial advice. Cryptocurrency trading involves substantial risk. Always do your own research before investing.