Here are the indicators and levels I use for macro accumulation, and how I combine them to decide when risk/reward starts to favor buying not trading, not guessing bottoms, but long-term positioning.
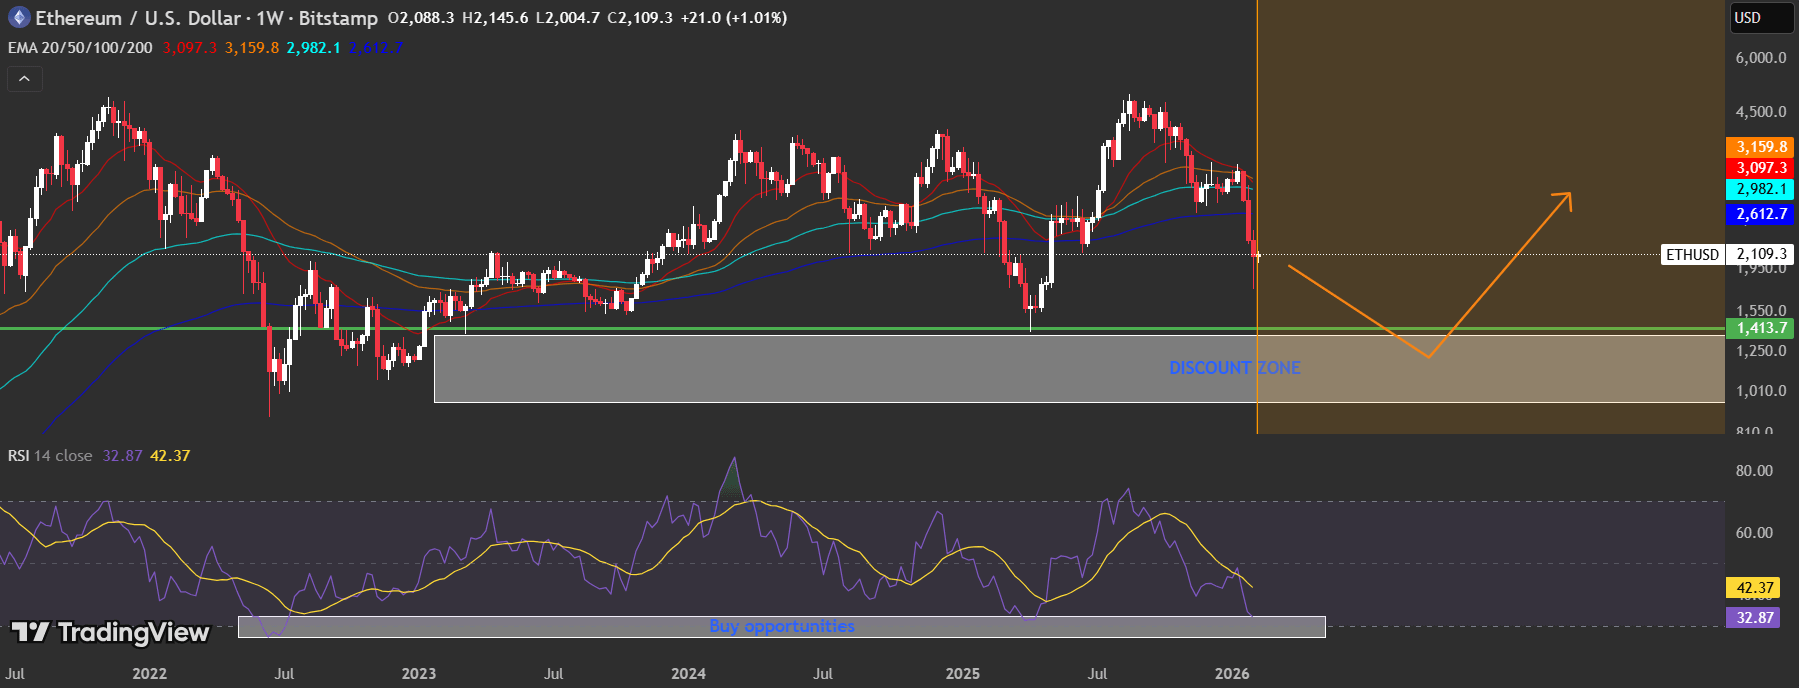
1️⃣ $2150 — 0.5 Fibonacci Level
The $2150 zone aligns with the 0.5 Fibonacci retracement of the larger move.
Why this matters:
* The 0.5 fib often acts as a psychological midpoint
* In previous cycles, this level frequently acted as:
- a reaction zone
- a pause before continuation
- or the first area where long-term buyers step in
I don’t treat this as a guaranteed bottom but it’s a first macro accumulation interest zone, especially if other conditions align.
2️⃣ $1400 — 2018 Top + April 2025 Rejection
The $1400 zone is structurally much stronger.
It represents:
* the 2018 cycle top (former resistance → potential support)
* a clear rejection area in April 2025, confirming it as a key market memory level
Markets tend to respect old highs and lows because:
* long-term participants anchor to them
* they often become zones of high liquidity
* they attract both defensive buyers and late sellers
3️⃣ RSI Below 30 — Macro Oversold
Historically, RSI below 30 on higher timeframes has marked:
* periods of extreme pessimism
* forced selling
* long-term opportunity, not comfort
Important:
* RSI < 30 does not mean price must reverse immediately
* it signals risk asymmetry starting to favor buyers
4️⃣ Below the Weekly 200 Moving Average
The Weekly 200 MA is one of the most important cycle filters.
In past bear markets:
* price often trades below the Weekly 200 MA
* true macro bottoms usually form after this condition is met
Being below it doesn’t mean cheap”by default but it confirms bear-market territory, which is where long-term accumulation historically makes sense.
5️⃣ Below the Monthly 100 Moving Average
The Monthly 100 MA adds a higher-timeframe confirmation.
When price is: below the Monthly 100 MA, it signals
* long-term trend damage
* compressed expectations
* reduced speculative excess
This combination has historically aligned with multi-year accumulation zones, not local pullbacks.
6️⃣ USDT.D Above 7%
Stablecoin dominance is a risk-off indicator.
When USDT.D is above ~7%:
* capital is parked on the sidelines
* fear is elevated
* risk appetite is suppressed
Macro accumulation tends to work best when:
* fear is high
* liquidity is defensive
* sentiment is negative
If this framework is useful, let me know if you’d like to see similar macro accumulation analysis for other assets.
Happy to break down additional charts using the same approach.
