
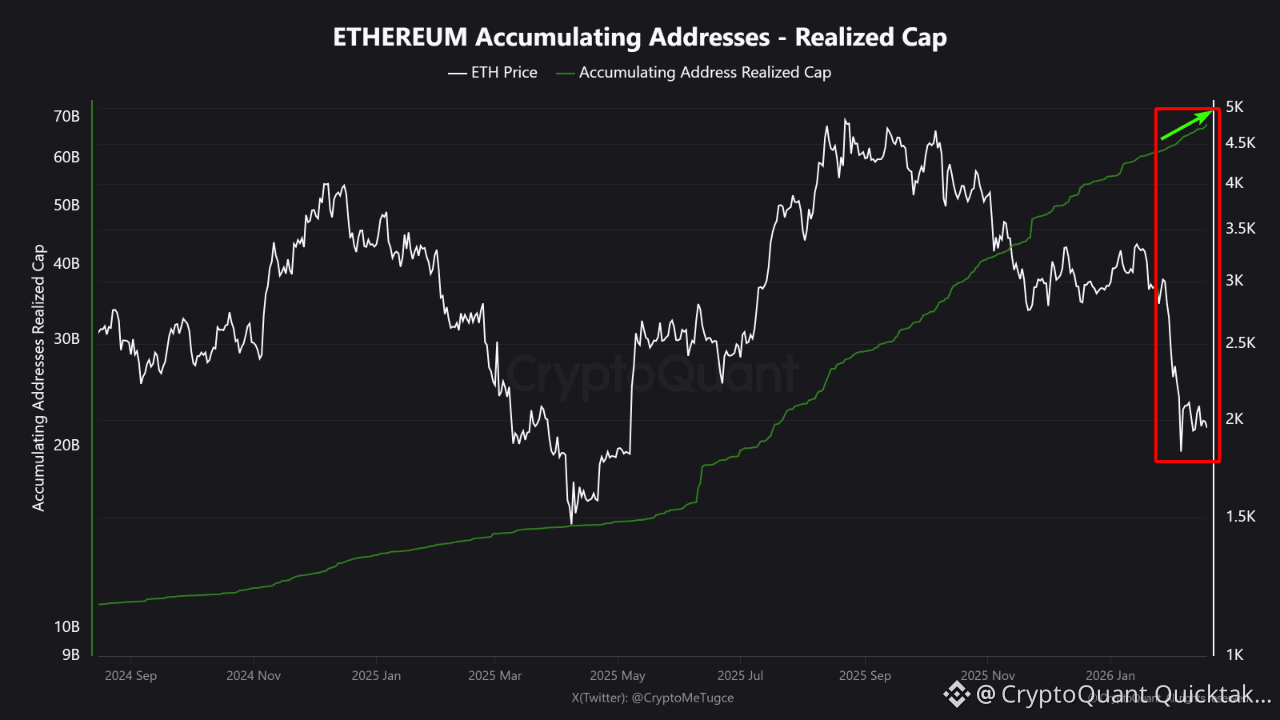
The realized price data of whale addresses that are accumulating ETH bent downward for the first time.
There are 2 possibilities for this metric to bend downward.
[1] - Either a whale with a higher average cost SOLD, and this caused the average to go down.
[2] - Or there are whales that BUILT THEIR COST at lower prices, and this pulled the cost basis downward.
⁉️ OK! Which one is correct? Which one caused Realized Price to go down?
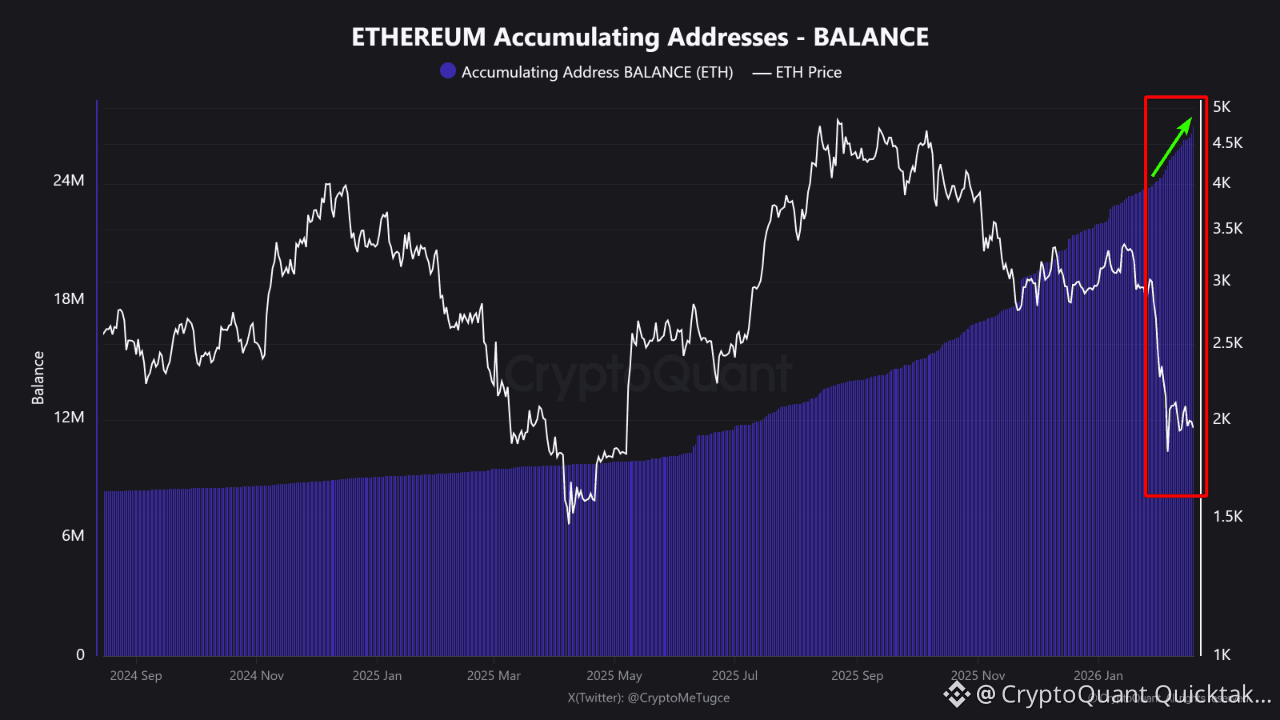
To understand which one is correct, we should also look at the Balance and Realized Cap data of the accumulating whales, next to this data.
When we also look at these 2 data sets, we see that "in the area where Realized Price bends downward", Balance increases, and Realized Cap also goes upward. From this, we understand that case [2] is the correct and valid case.
✅ So there is no selling behavior in the Accumulating Whales. On the contrary, there is buying at lower prices, and this is why Realized Price bends downward. The accumulating whales’ trust in ETH still looks strong.
⚠️ BUT, DO NOT FORGET!
This data and analysis does not represent the whole ETH universe. It is only data specific to the "accumulating whales" cohort, and it shows us their situation. But the ETH price can keep moving down or up in the short and medium term depending on other factors and the behavior of different investor groups.

Written by CryptoMe