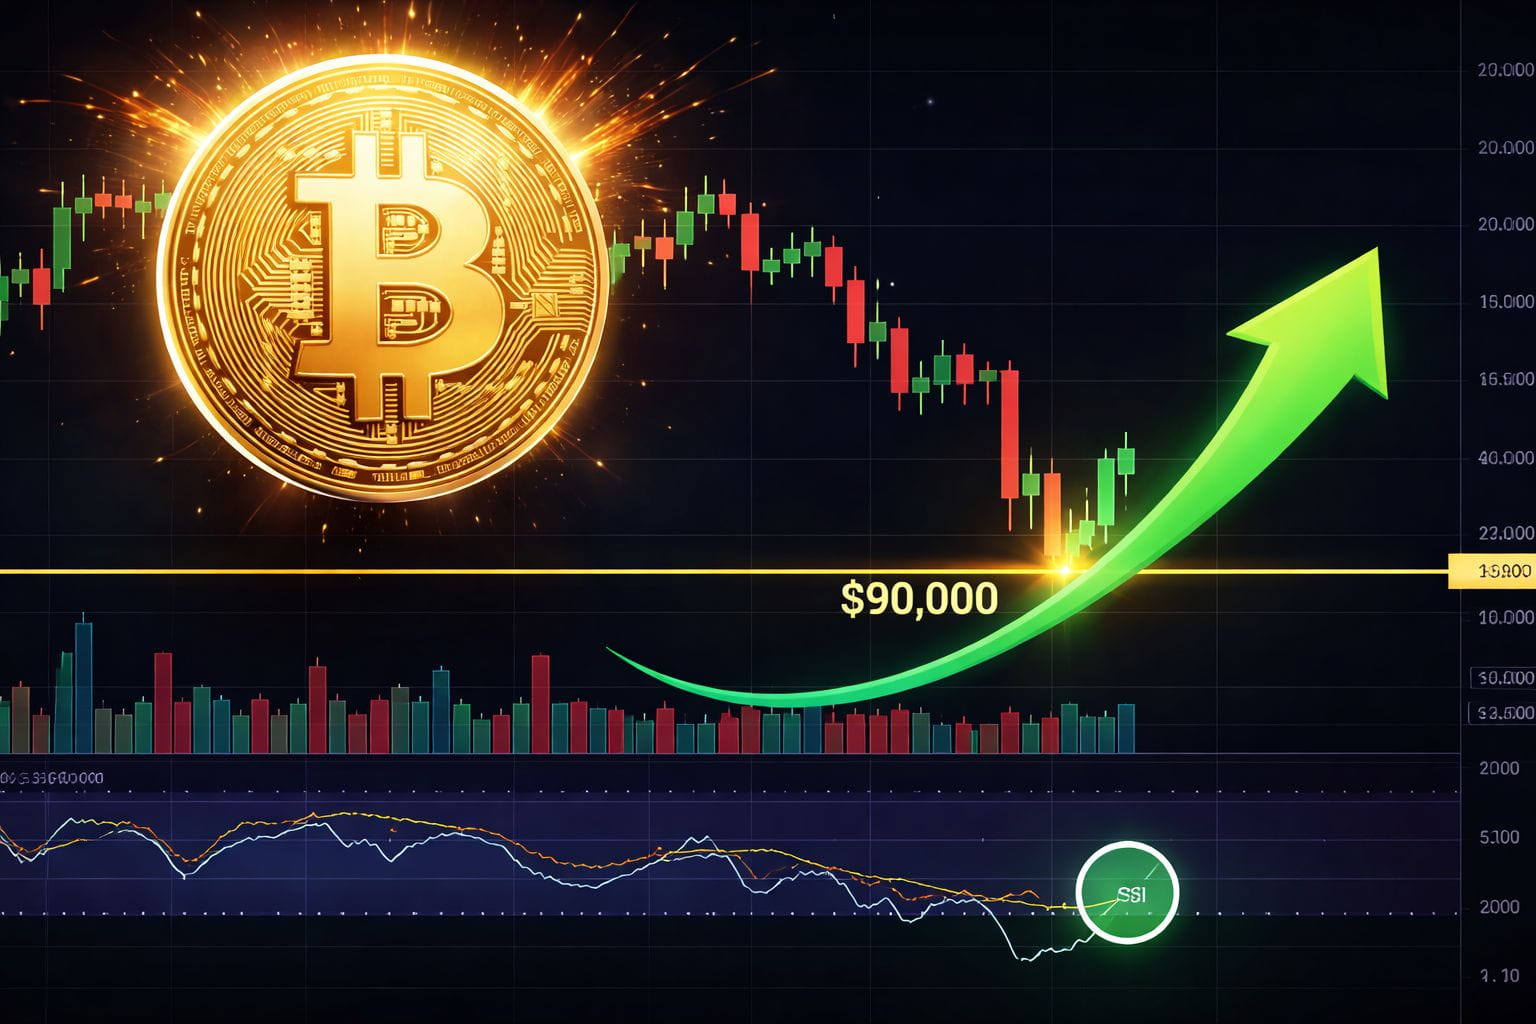
Bitcoin $BTC is showing clear signs of a bullish reversal near current price levels. Multiple technical signals suggest that any dip below $90,000 should be viewed as a strong buying opportunity.
Let’s break it down simply 👇
🔹 1. 4H RSI Deeply Oversold (Rare Signal)
On the 4-hour timeframe, Bitcoin’s RSI has dropped into oversold territory, reaching its lowest level since 21 November 2025.
This is important because:
Since the correction began, the 4H RSI has gone oversold only twice
Both times (21 Nov & 1 Dec), Bitcoin reversed and moved higher
After those events, RSI never reached oversold again… until now
Historically, 4H RSI oversold = reversal incoming.
🔹 2. Bearish Momentum Is Weakening
The highest selling volume during this drop appeared on 15 January.
However:
On 19–20 January, Bitcoin made a lower low
But volume was significantly lower
This is a classic sign of bearish exhaustion — sellers are losing strength.
🔹 3. Rare 6 Consecutive Red Daily Candles
On the daily timeframe, Bitcoin rarely prints long red streaks:
5 red days in a row is already uncommon
6 red days has happened only once before, in May 2023
After that event, Bitcoin turned bullish the very next day
We are now on the 6th consecutive red daily candle, making this setup statistically significant.
🔹 4. Structure Still Bullish Above $90K
Despite the pullback:
Bitcoin is forming a higher low compared to 21 November
Price action remains above the key $90,000 level
This keeps the overall bullish structure intact.
 🎯 Final Thoughts
Pullbacks here are not a reason for fear — they are opportunities to buy, rebuy, and reload.
The relief rally is not over.
📌 Key Zone:
Any trading below $90,000 should be considered a strong buy area in anticipation of bullish continuation.

#MarketRebound #BTC100kNext #BTCStrategy #BuyTheDip #BTCvsGOLD